VPCLevels – Confluence Indicator
What’s Included
- 30+ Proprietary Algos
- 50+ Advanced Indicators
- 4 Complete Trading Systems
- In-Depth User Documentation
- White Glove Installation & Ongoing Support
- Prebuilt Optimized Strategy Templates
- Deep-Dive Video Courses & AMA Sessions
Only for Ninjatrader Platform
Overview:
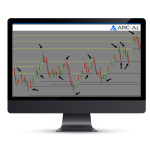
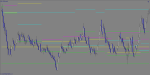
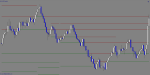
VPCLevels is a multi-timeframe volume profile confluence indicator used for detecting the strongest levels of support and resistance using volume. The software analyzes a large lookback of historical data to identify high probability confluence lines where price action is likely to pause or to reverse. Multiple timeframes are included in the historical analysis making it possible to locate the best levels from a single chart. Sensitivity adjustments allow for the finetuning of the levels being displayed.
Purpose:
Traders need the VPCLevels because finding confluence volume levels of support and resistance across hundreds of days of historical data and multiple timeframes is humanly impossible to do manually. Without the benefit of software processing a large volume of data, many important levels can be missed. Using the VPCLevels software, traders can wait for the best locations to enter and focus on risk and trade management once those levels are reached. The easy to read levels are displayed right on the trading chart and historical levels are displayed making it easy to backtest for the best settings.
Elements:
- Multiple Timeframe Confluence Algorithm
- Easy to read support and resistance levels displayed right on the price chart
- Sensitivity adjustment options to control the frequency of confluence levels
- Differentiate volume profile components for easy identification
- Option to extend levels to the hard right edge
- Customizable background timeframe supports flexible granularity of analysis
Functions:
The VPCLevels software is best used as a leading indicator showing the best locations to trade once price reaches those levels. The ideal settings for each instrument can be achieved by visually observing the price reactions on previous days levels being displayed on the chart. Once the ideal settings are selected, the trader can focus on entering and managing trades at the right locations.of Allowing the software to process hundreds of days of historical data ensures the best and most stable locations are found.
Problem Solved:
- Stops traders from trading the wrong side of support & resistance
- Stops traders from missing out on the most important levels
- Stops traders from relying on lagging indicators which lack sufficient lead times to engage
- Stops traders from chasing the market by knowing what price to wait for
- Stops traders from failing to adjust their strategies to the specific characteristics of each instrument
- Stops traders from taking excessive risk by knowing where strong support and resistance is located