Frequencies
THIS PRODUCT IS INCLUDED WITH THE ALL-IN-ONE SUBSCRIPTION
- 30+ Proprietary Algos
- 50+ Advanced Indicators
- 4 Complete Trading Systems
- In-Depth User Documentation
- White Glove Installation & Ongoing Support
- Prebuilt Optimized Strategy Templates
- Deep-Dive Video Courses & AMA Sessions
Only for Ninjatrader Platform
Overview:
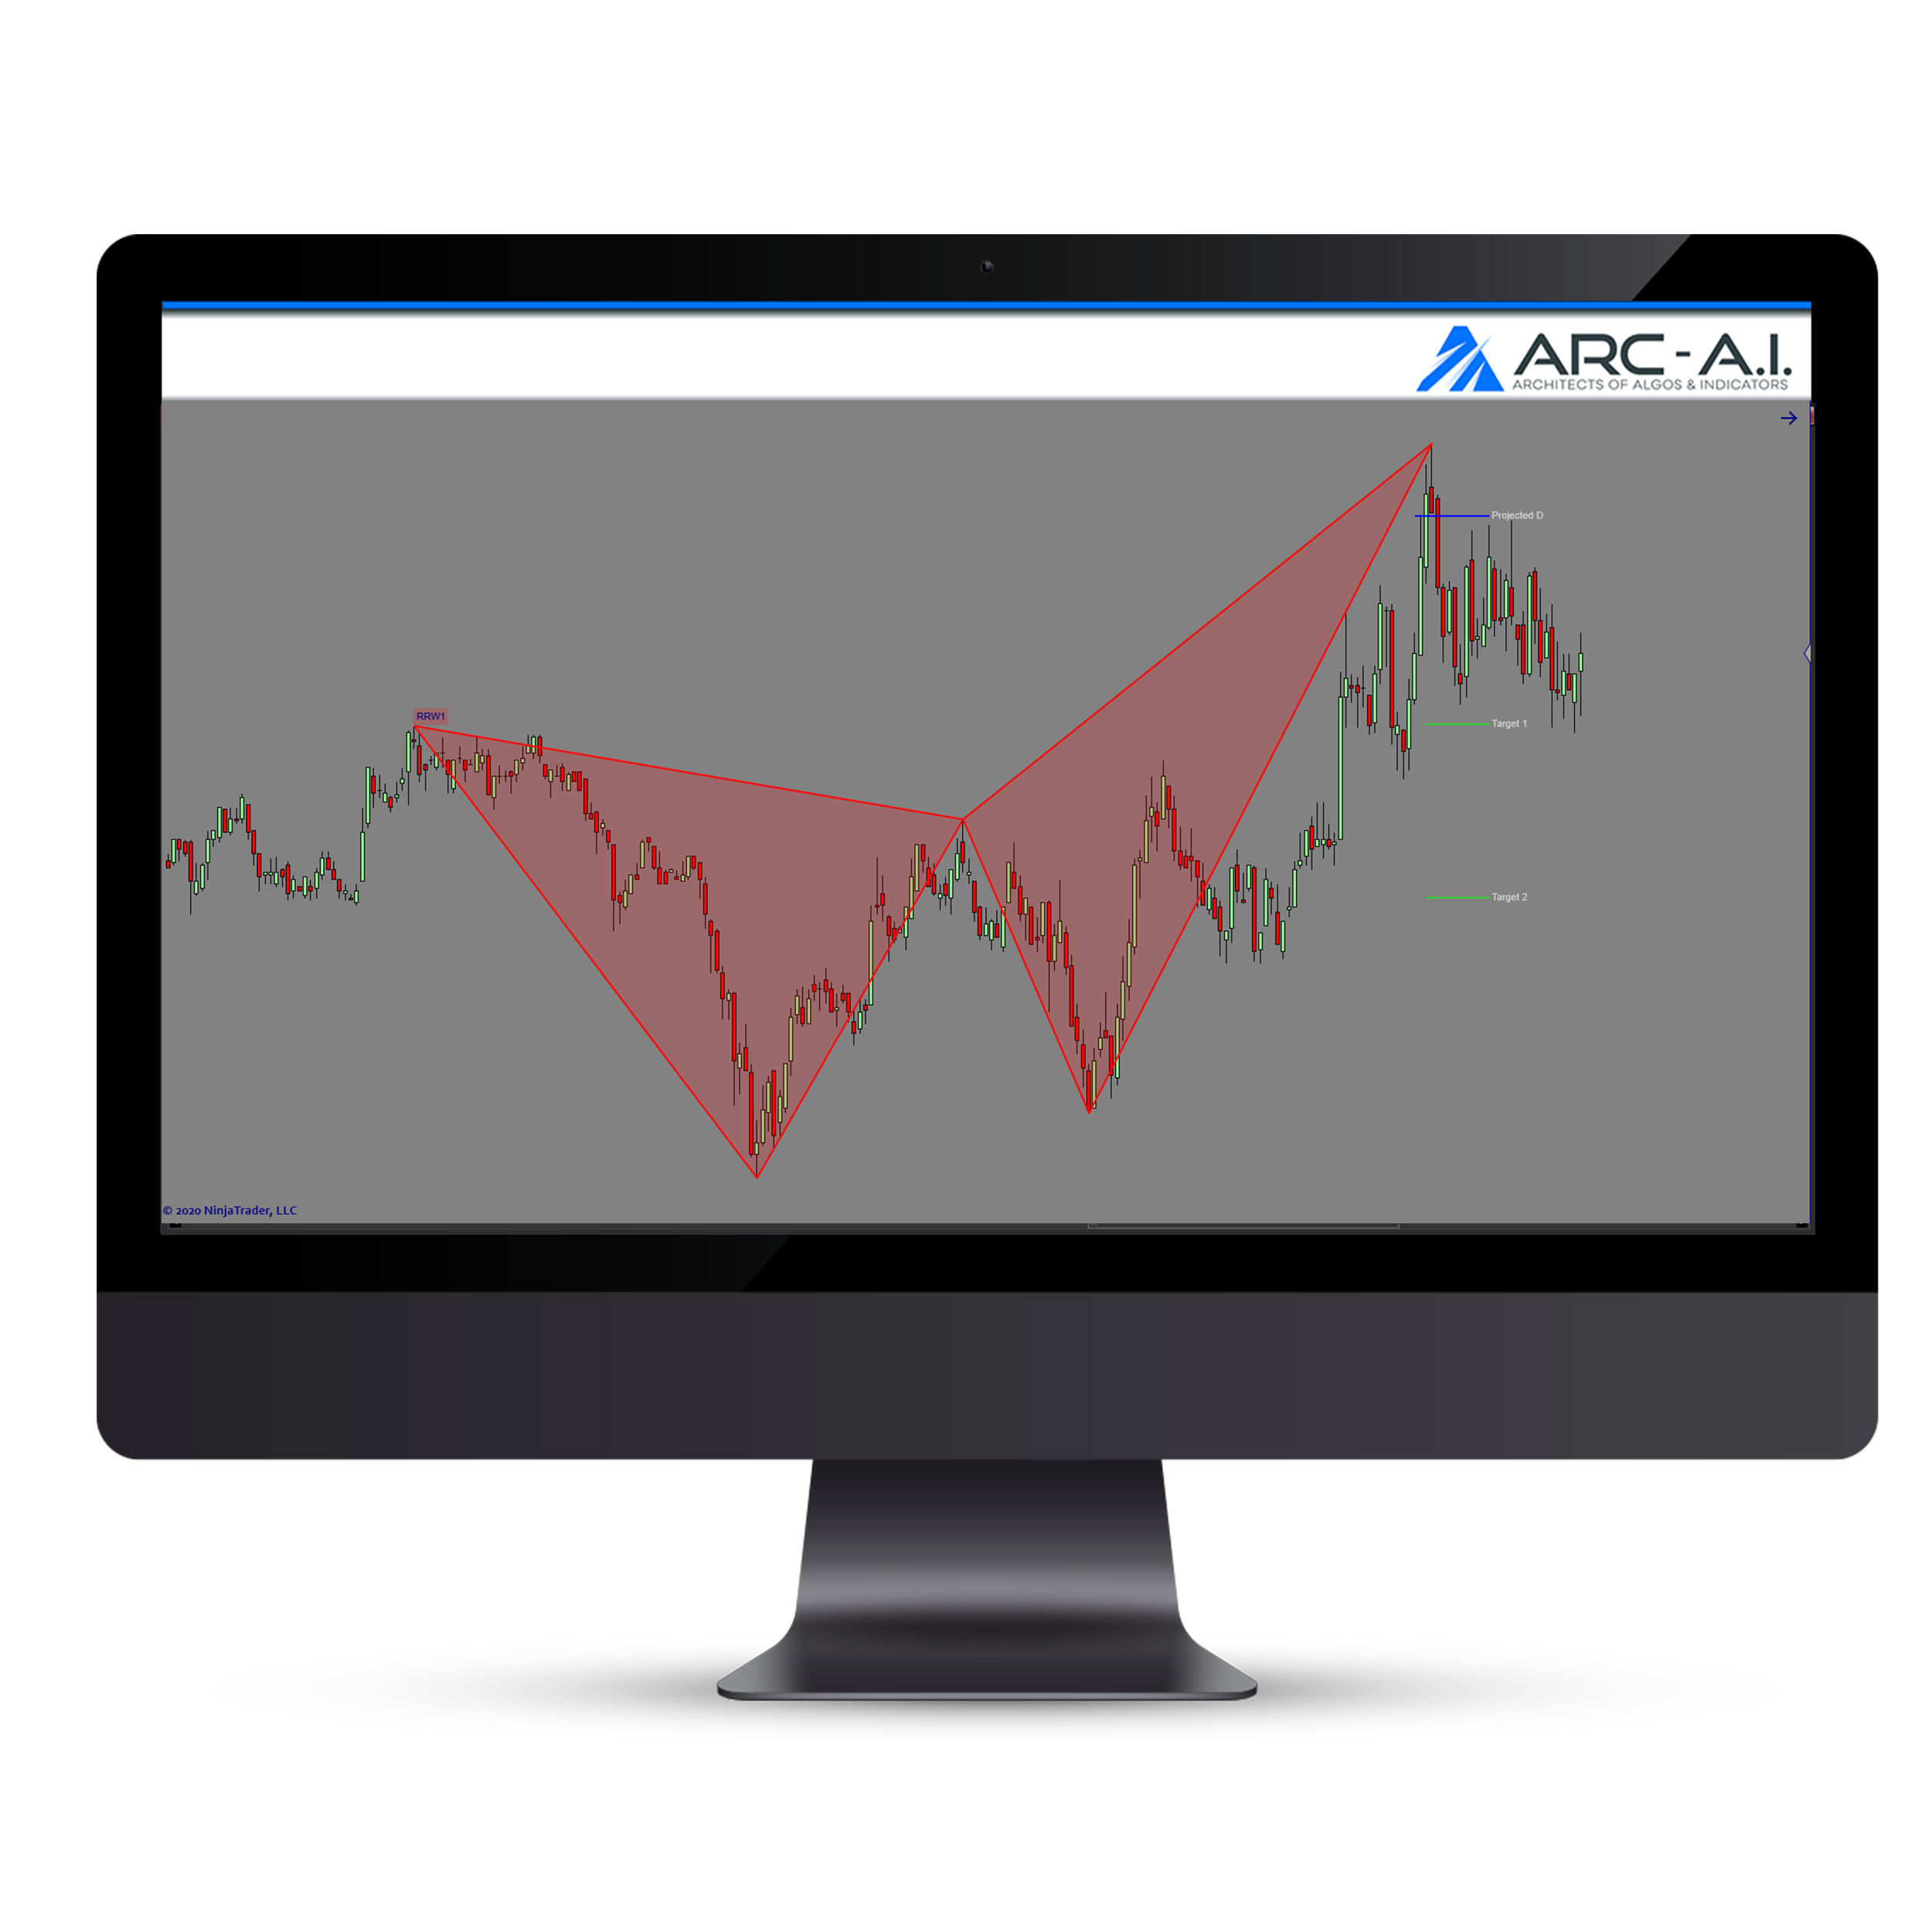
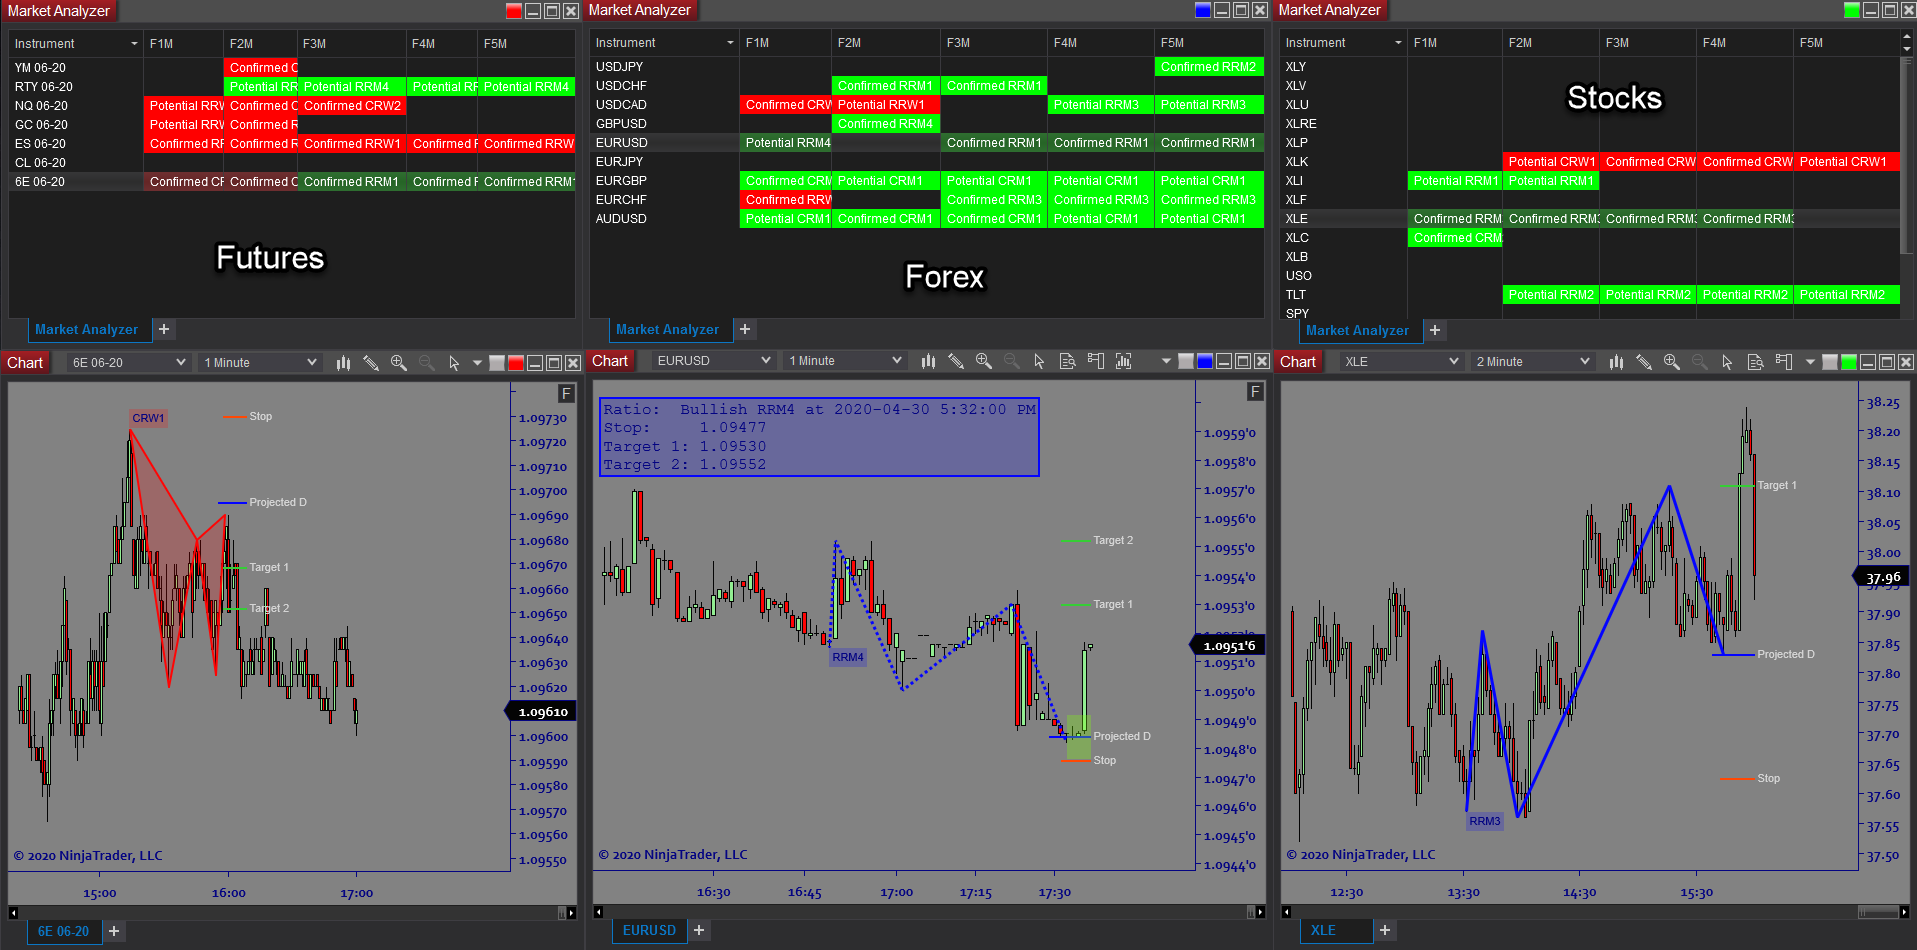
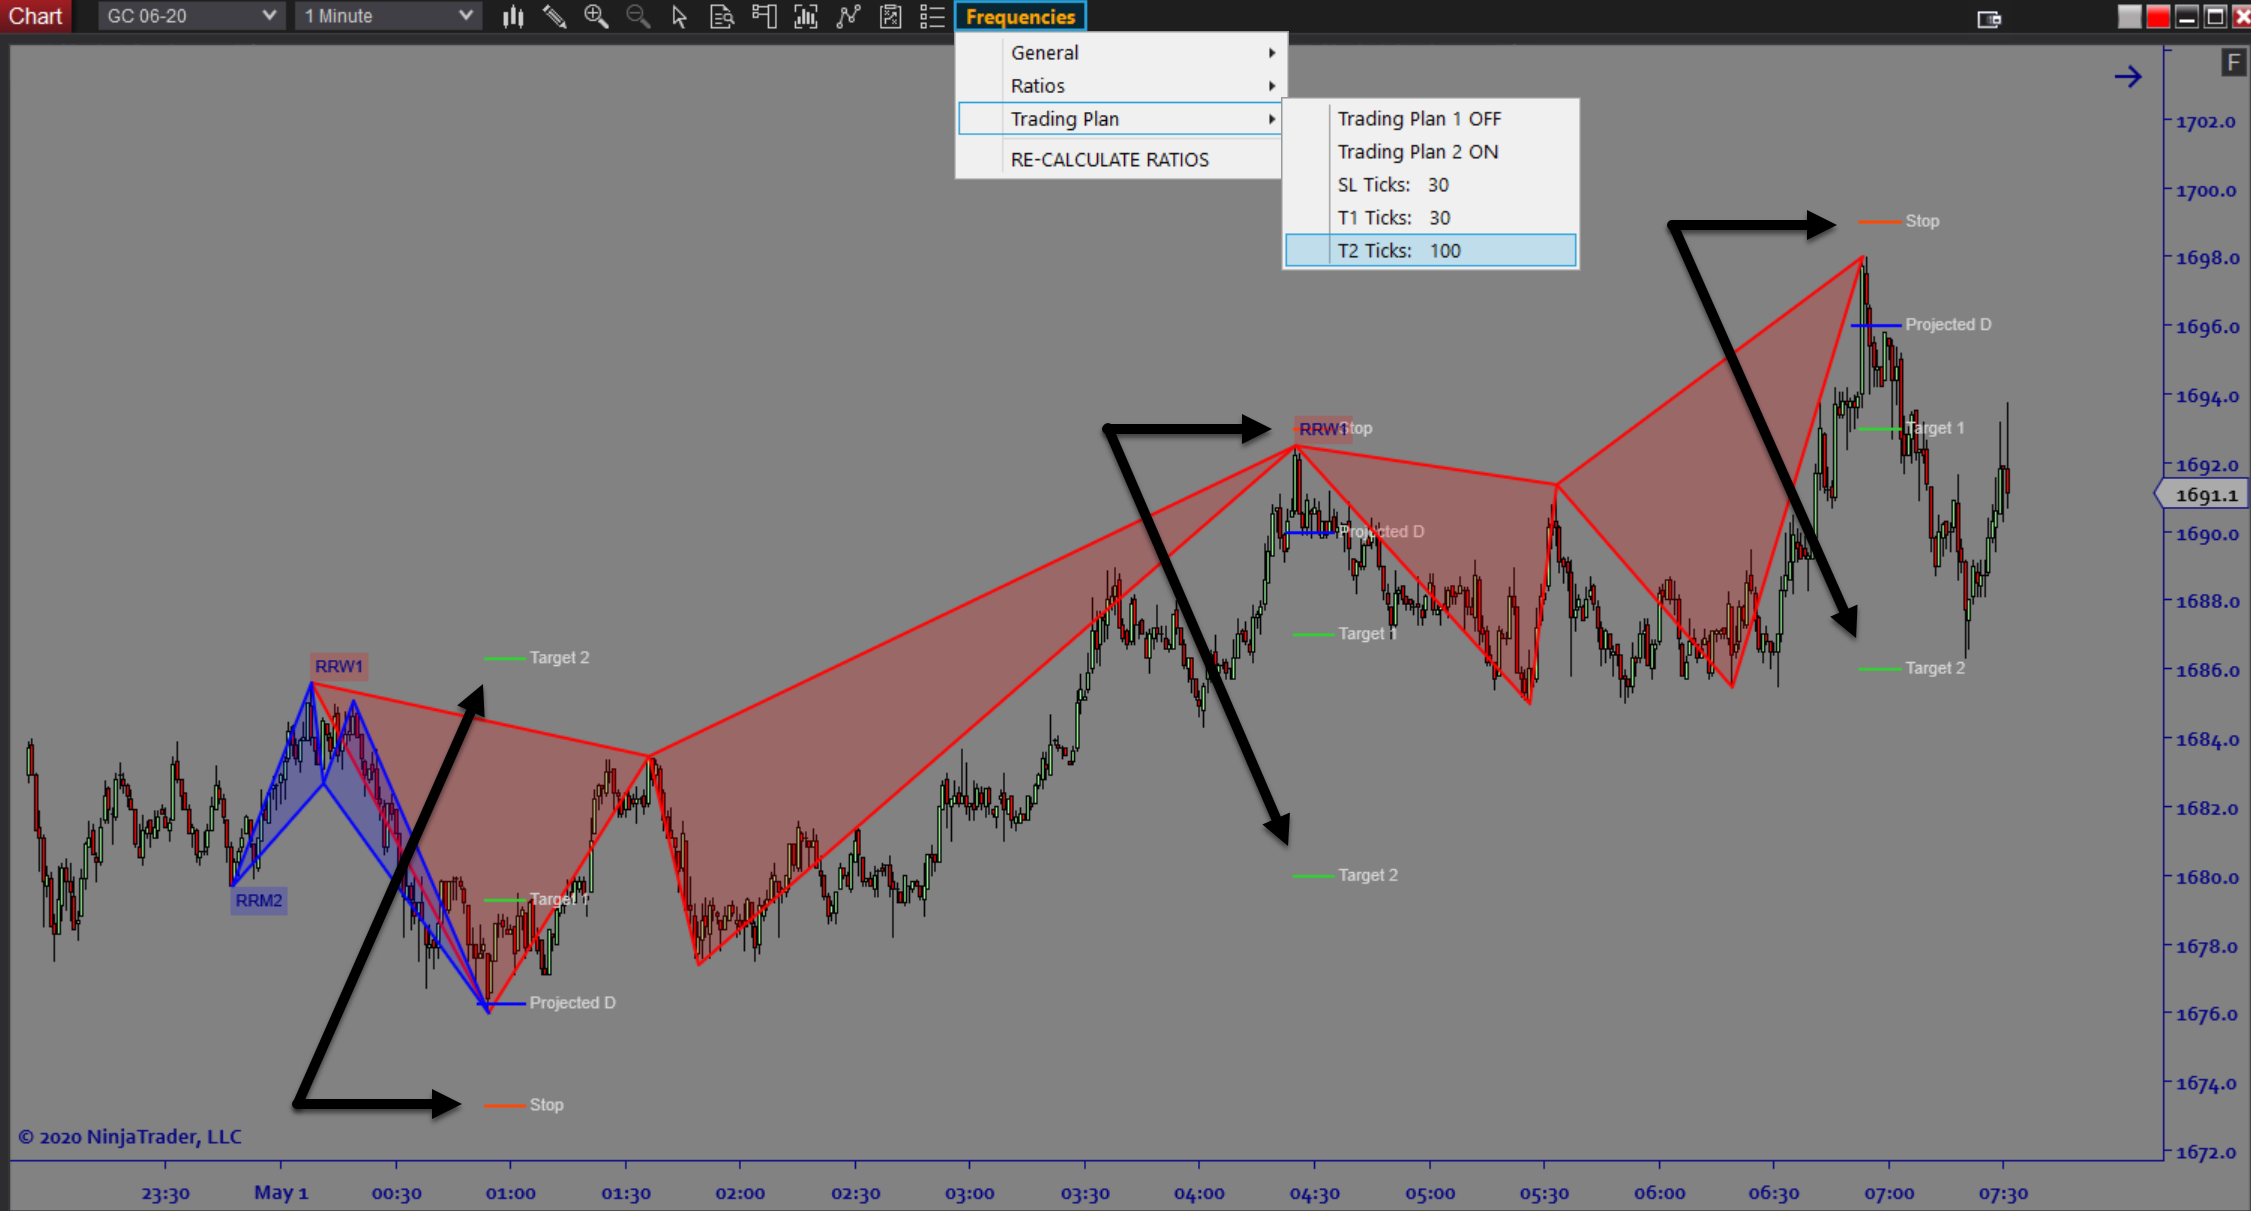
Frequencies is an automated Mathematical Ratio indicator used for detecting the strongest reversals and continuation ratios using Fibonacci math and statistical pattern recognition. The software continually scans price action to detect potential Ratio patterns. When a pattern is recognized and confirmed, a customizable trade plan is immediately displayed. There is also an option to display a software-generated trade plan, based on the Ratio math of the detected pattern. This takes the guesswork out of trading complex pattern recognition.
Purpose:
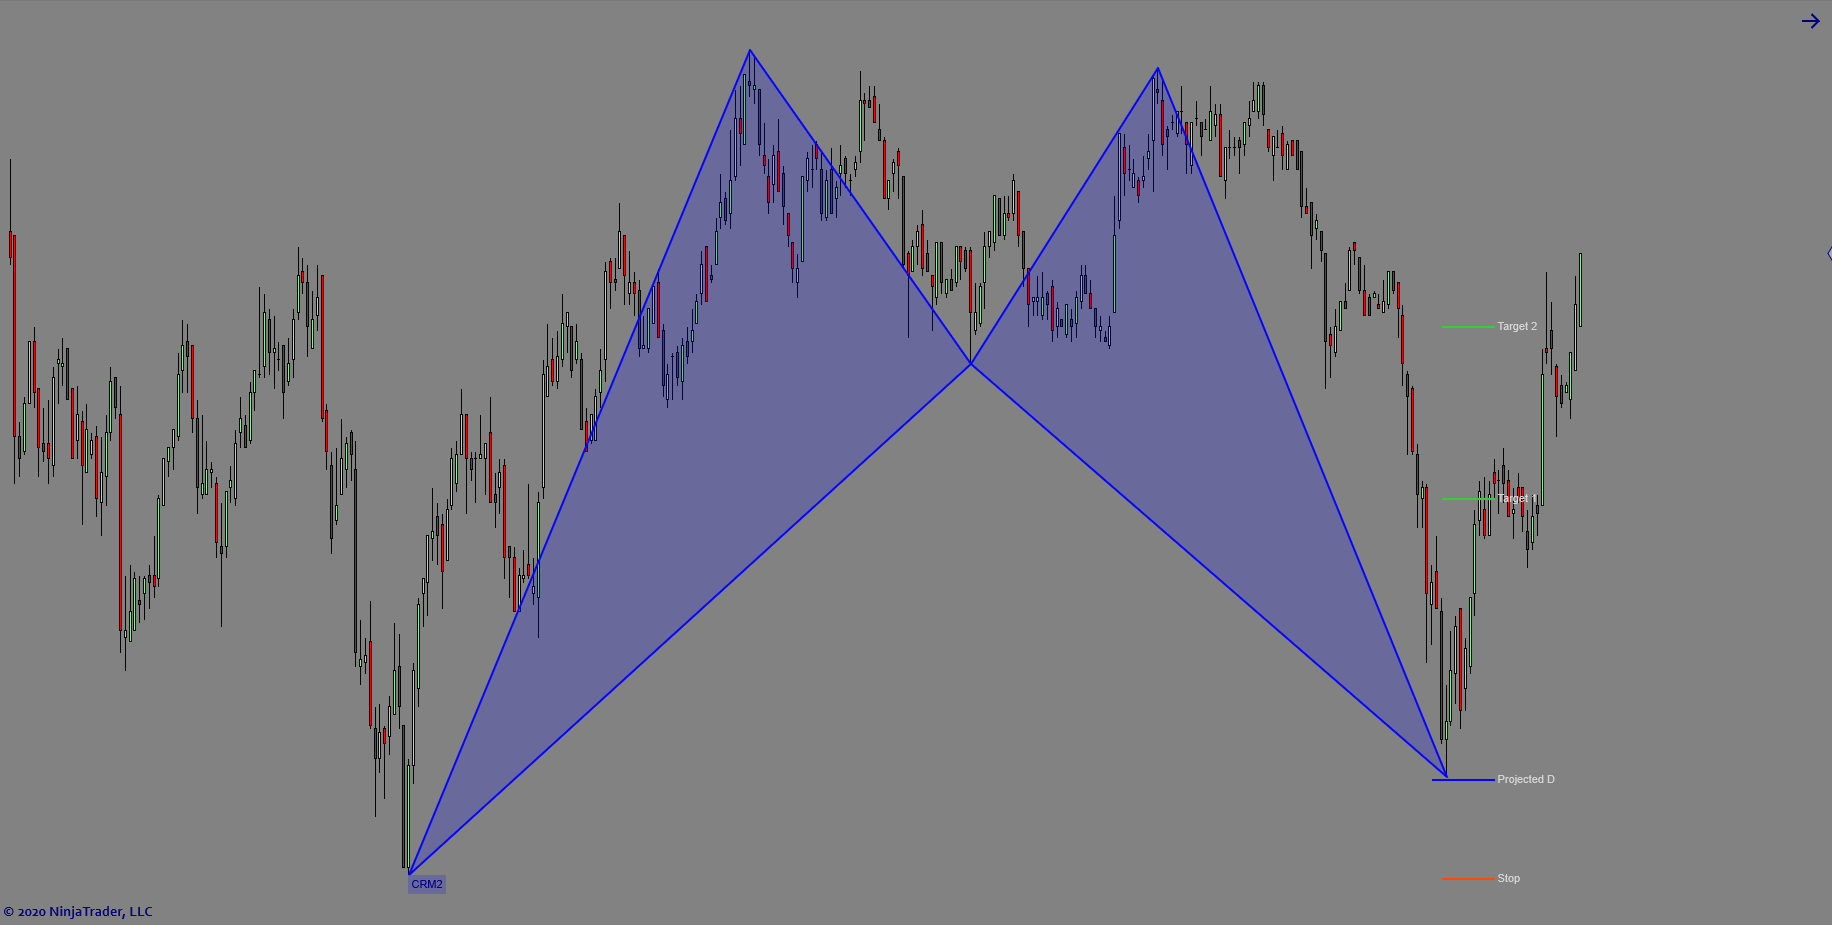
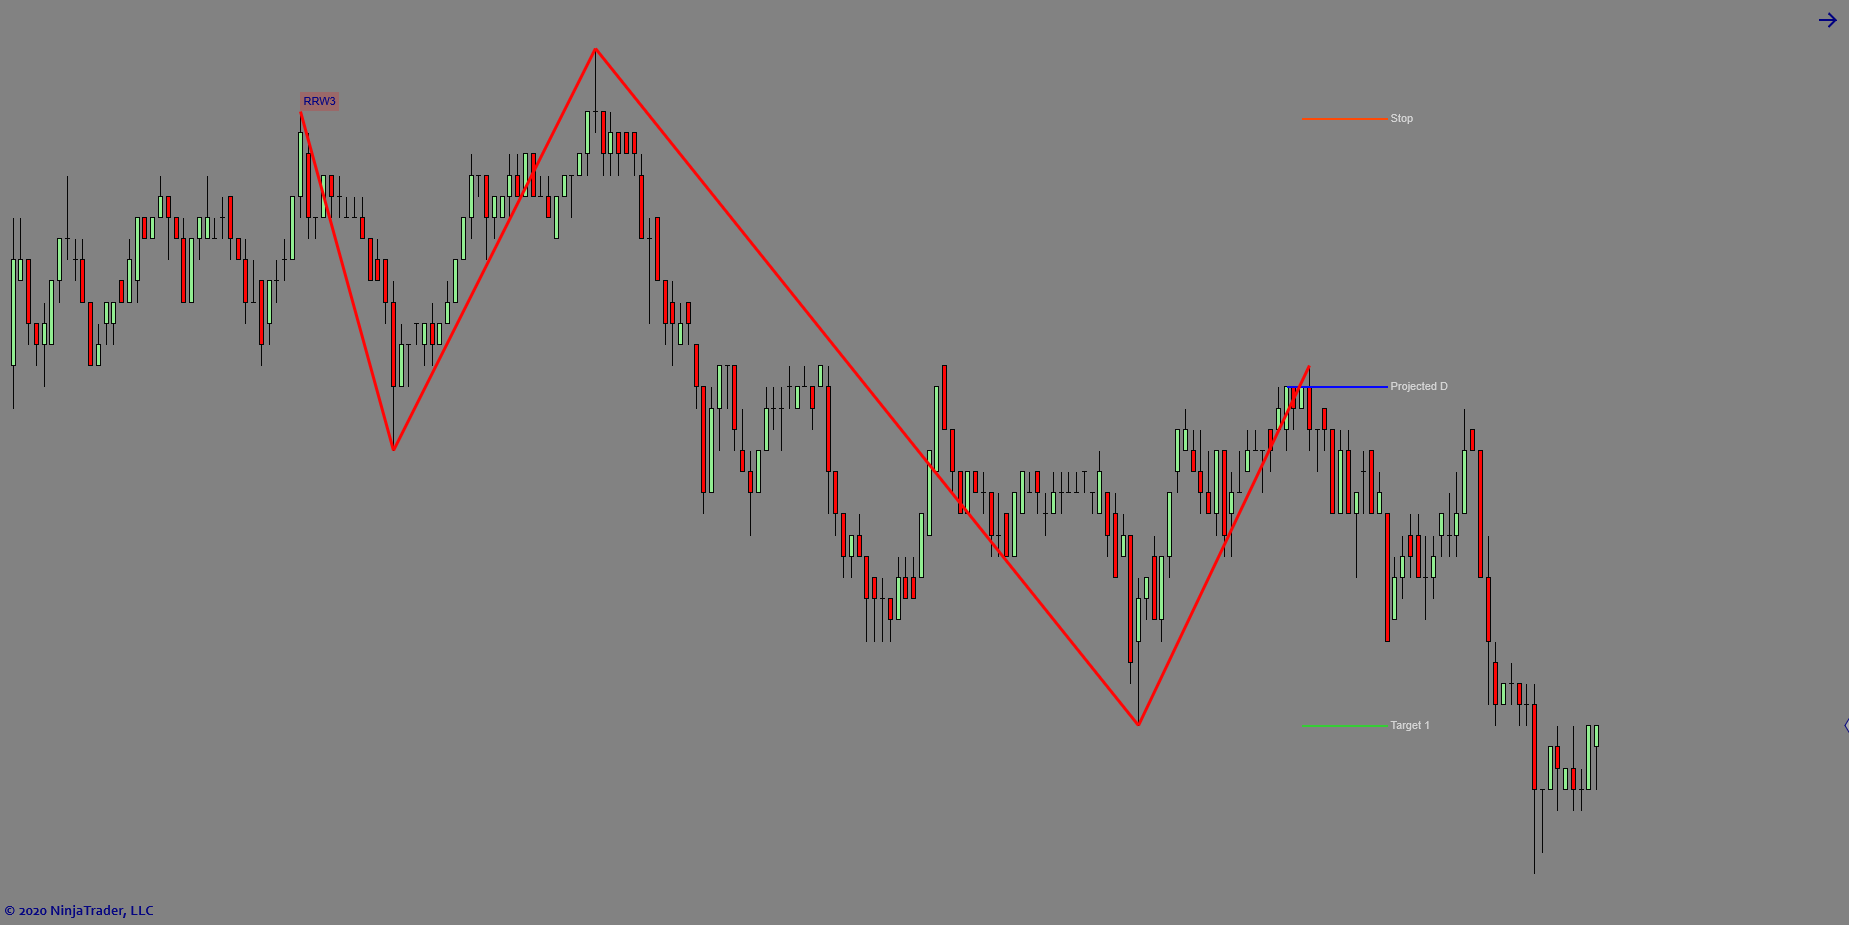
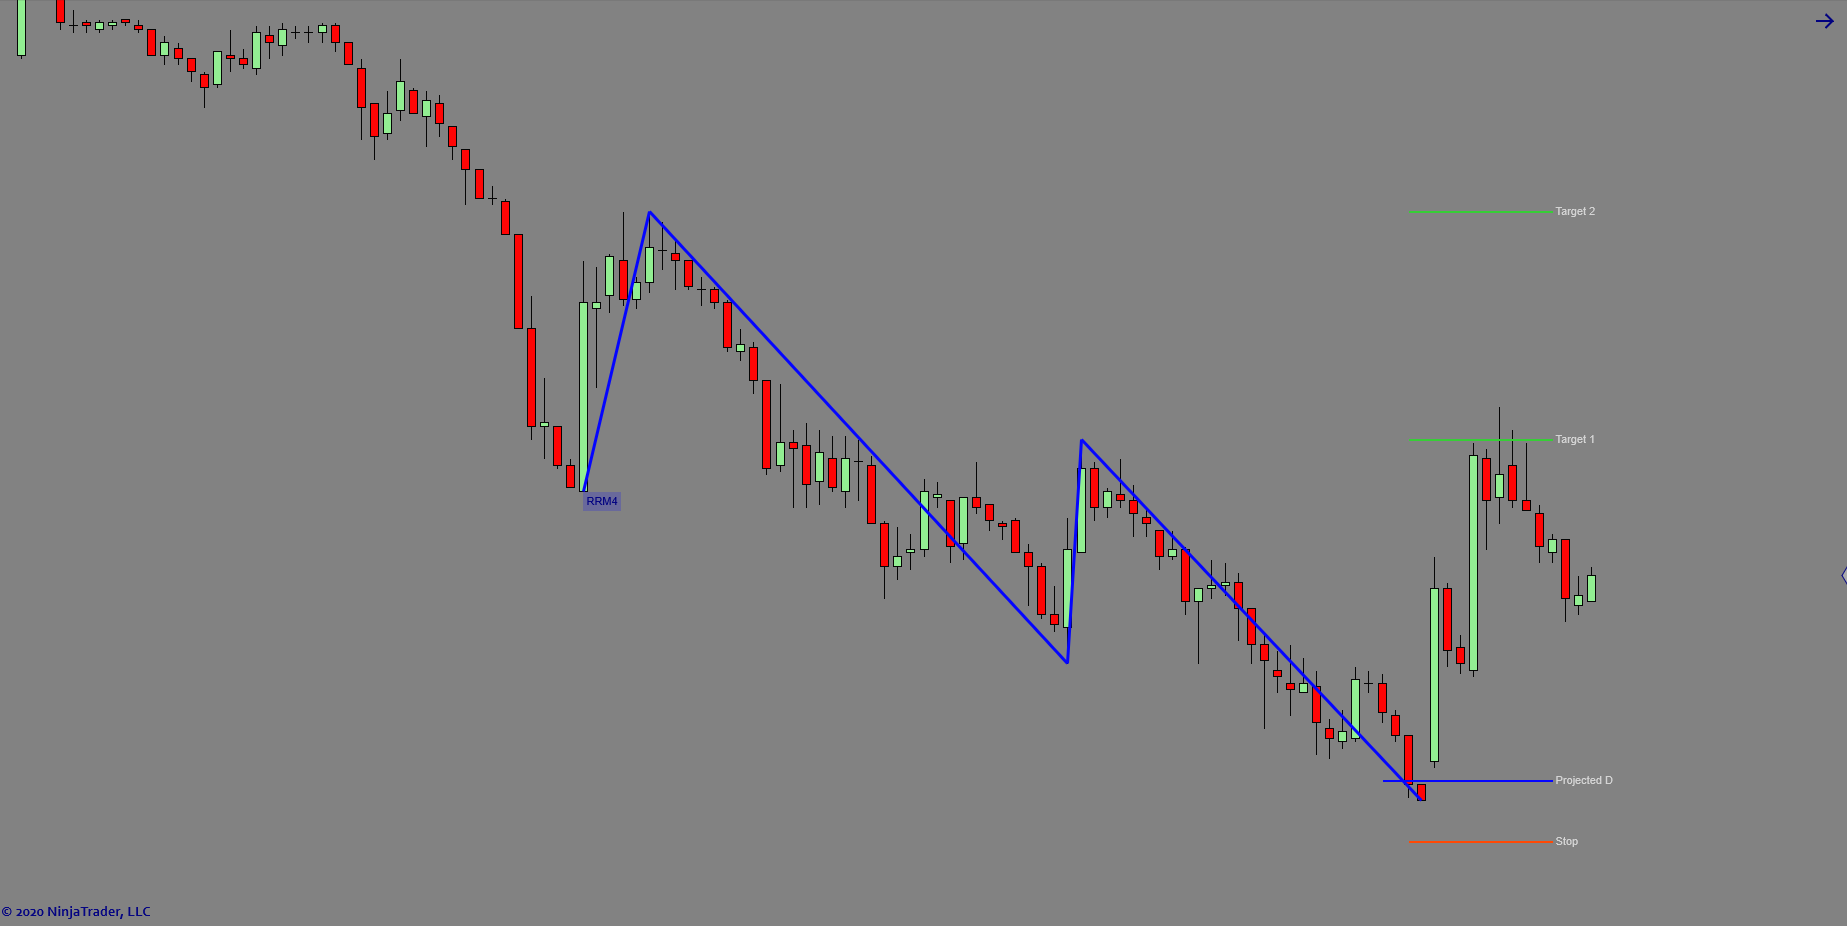
Traders need the Frequencies software if they want to efficiently trade complex Ratio patterns. Ratio patterns are very effective but they require complex mathematical calculations for detection. It is very difficult to do this manually, even for a single market. Trying to do this across multiple markets and timeframes is virtually impossible without the use of software. The Frequencies software can scan across multiple instruments and various timeframes as desired and instantly alert you to the upcoming trade setup. An Entry Price, Stop Price, and 2 Target Prices are displayed right on the chart, transforming a complex trading strategy into a simple and clear process. This frees up the traders time to focus on market conditions, trade selection, and trade management once a setup is taken.
Elements:
- Math based automatic detection of major Ratio patterns
- “M” Ratios (Buy setups) & “W” Ratios (Sell setups)
- Early warning (Potential Ratio detection) feature providing ample time to plan the trade in advance
- Pattern Info Box displaying critical info about the current pattern setup
- Multi Timeframe scanner across multiple markets
- Customizable Trade Plans (Entry, Stop, and 2 Targets)
- Software-generated Trade Plans (based on mathematical ratios)
- Historical Patterns for backtesting and strategy development
Functions:
The Frequencies software is best used by setting up a scanner for as many instruments and timeframes as desired and having linked charts that display the detected patterns when found. Every time a detected pattern is generated, an alert sounds and the instrument and timeframe of the setup is displayed. The trader can then simply switch to the chart of that instrument to see the pattern and trade plan instantly. At that point all that is needed to enter the market and adjust the stop and targets according to the displayed trade plan. Being able to utilize such a wide ranging scan allows you to take only the very best setups.
Problem Solved:
- Stops traders from having to do complex math which is too difficult to do manually
- Stops traders from second guessing Ratio pattern setups
- Stops traders from wasting time looking for setups which can only be identified by using software
- Stops traders from missing trades that are too difficult to see with the naked eye
- Stops traders from being limited to trading only a few markets
- Stops traders from entering too late and missing out on most of the profits
- Stops traders from placing stops in the wrong location
- Stops traders from setting targets that are either too close or too far away


