Frequently Bought Together
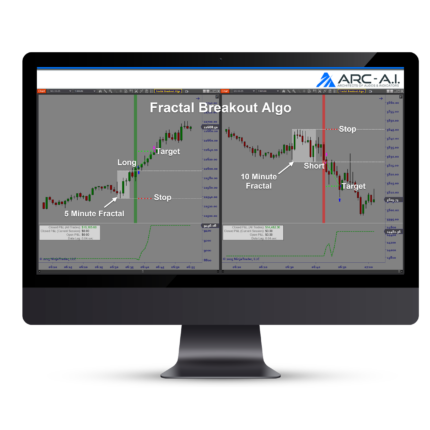
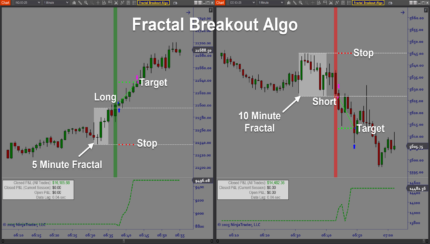
Fractal Breakout Algo
INCLUDED
- Code & Updates Available on NT8 | 2 PC : $1990
- Custom Built Algo ENGINE 2.0 : $1990
- Detailed User Documentation : $495
- White Glove Install & Ongoing Support : $995
- Prebuilt Optimized Templates : $995
- Deep Dive Algo Video Course : $995
- Live VIP Algo Training AMA's : $995
- TOTAL VALUE
:
$8450
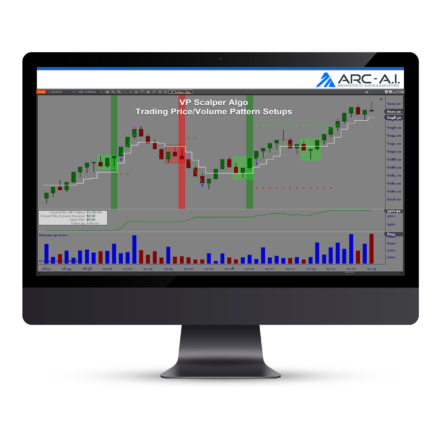
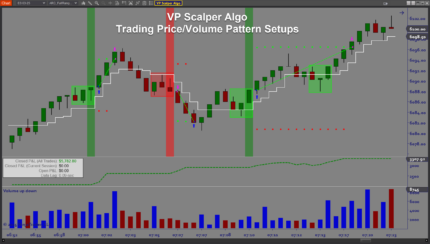
VP Scalper Algo
INCLUDED
- Code & Updates Available on NT8 | 2 PC : $1990
- Custom Built Algo ENGINE 2.0 : $1990
- Detailed User Documentation : $495
- White Glove Install & Ongoing Support : $995
- Prebuilt Optimized Templates : $995
- Deep Dive Algo Video Course : $995
- Live VIP Algo Training AMA's : $995
- TOTAL VALUE
:
$8450
One and Done System
ONE AND DONE SYSTEM PACKAGE
- Pre-Built Workspaces : $495
- Live Trading Social Proof Results : $495
- Strategy Cheat Sheets (Trade Plan) : $495
- Trading VIP Masterclass (Recorded) : $795
- Live Trade Room Trial (System Exposure) : $995
- Unlimited Support (White Glove) : INCLUDED
- TOTAL COMBINED VALUE
:
$3,275 - Discount (78% off) NOW ONLY : $749
Div Algo
INCLUDED
- Code & Updates Available on NT8 | 2 PC : $1990
- Custom Built Algo ENGINE 2.0 : $1990
- Div Algo Discord Group : $495
- Detailed User Documentation : $495
- White Glove Install & Ongoing Support : $995
- Prebuilt Optimized Templates : $995
- Deep Dive Algo Video Course : $995
- Live VIP Algo Training AMA's : $995
- TOTAL VALUE
:
$8950


