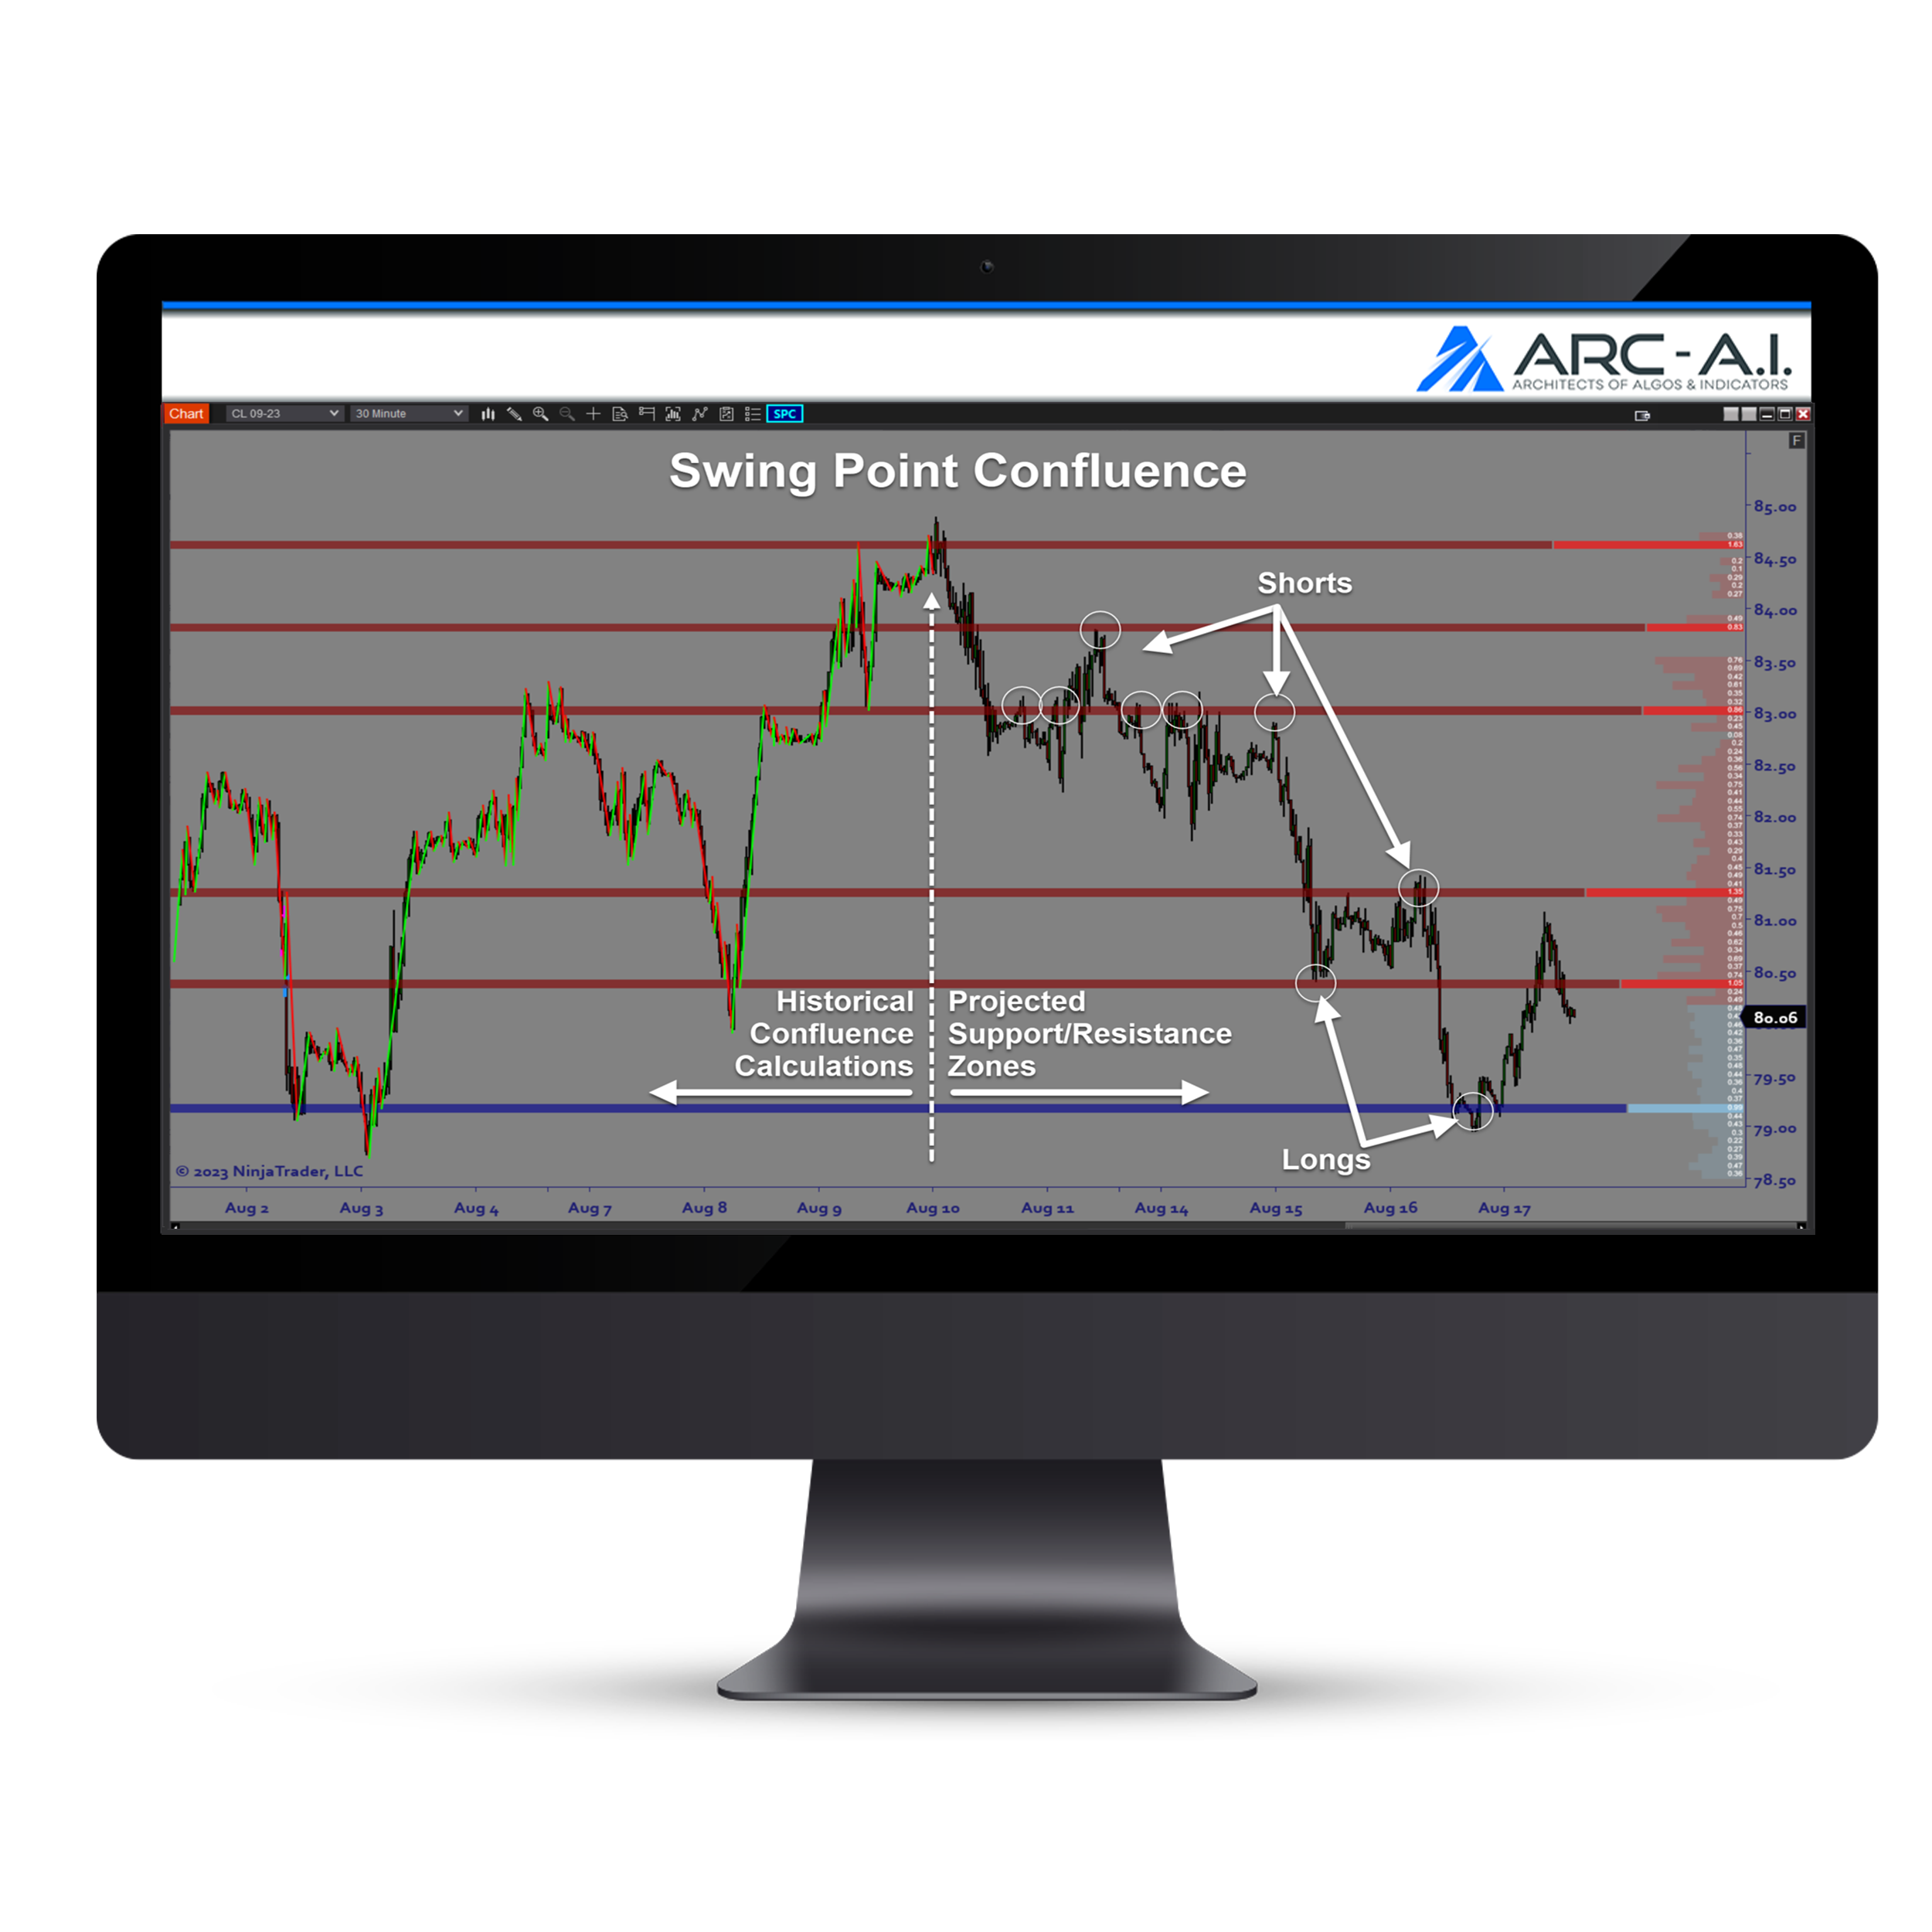
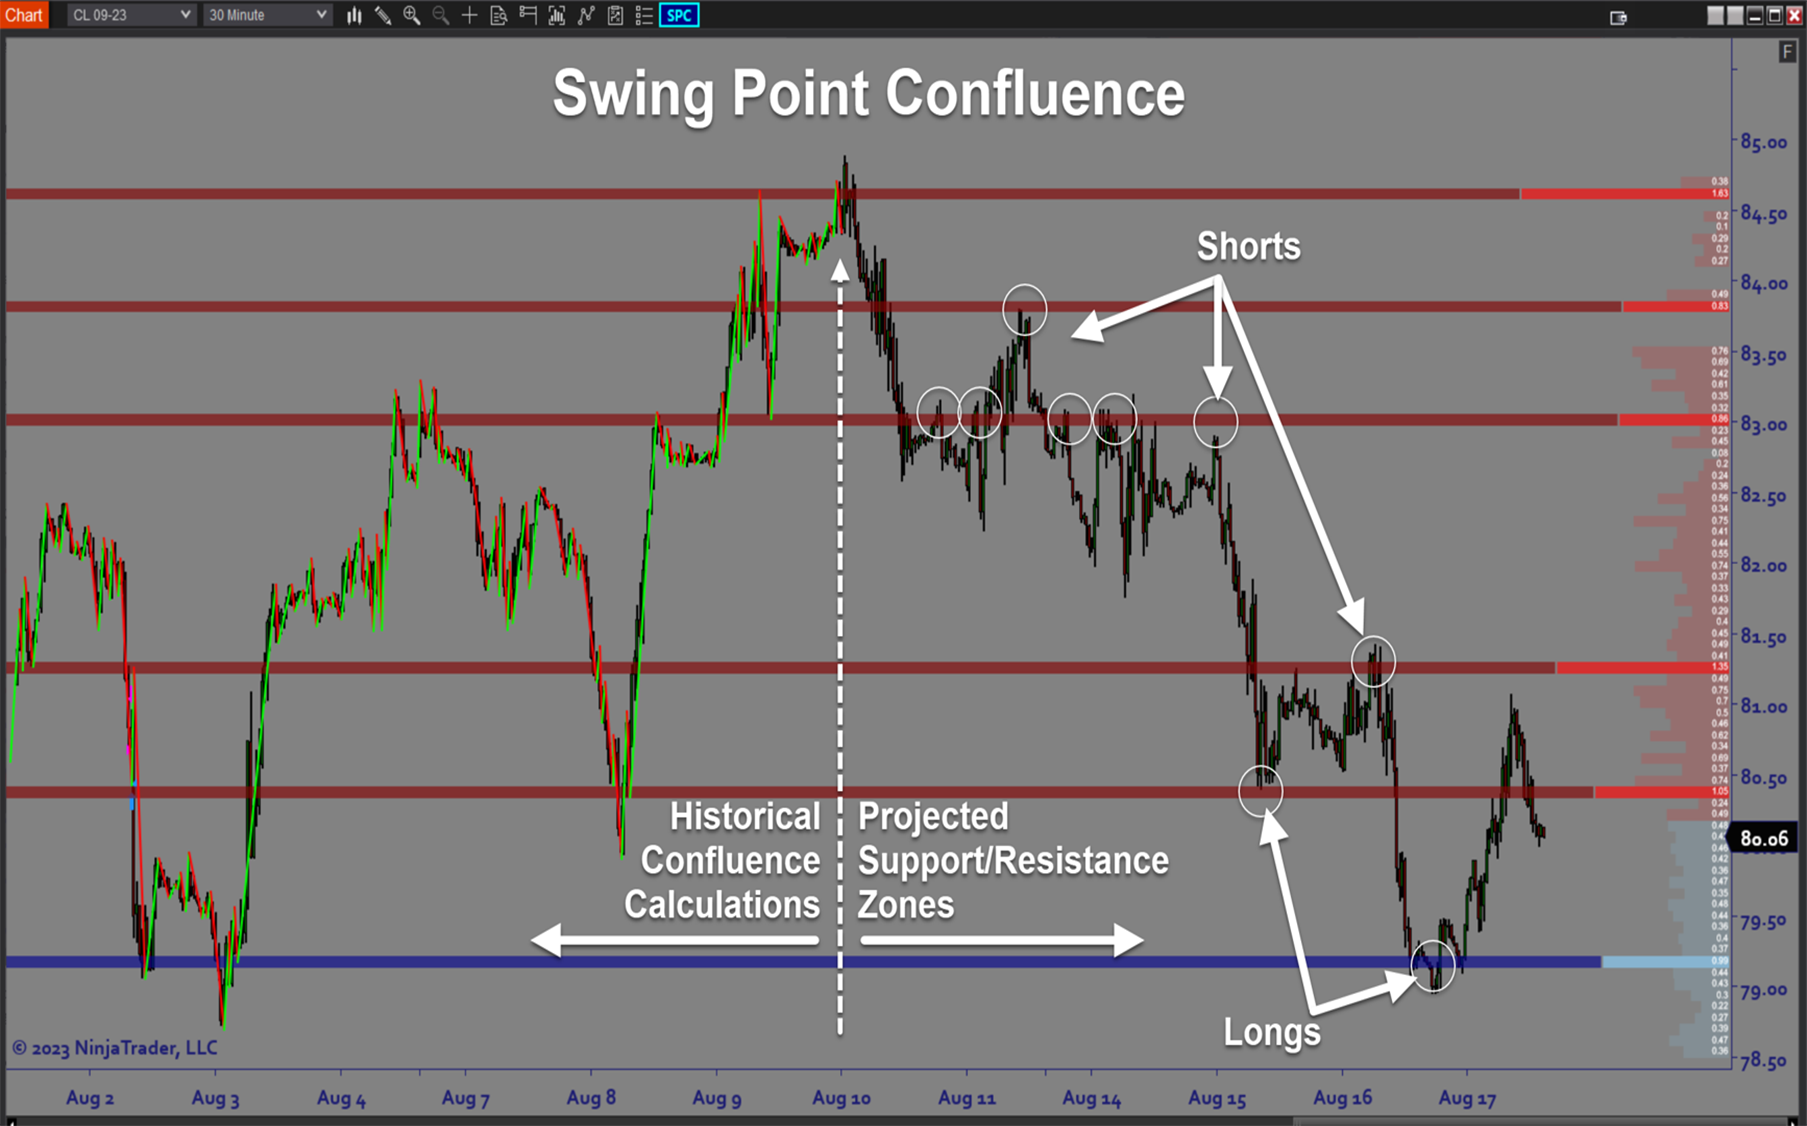
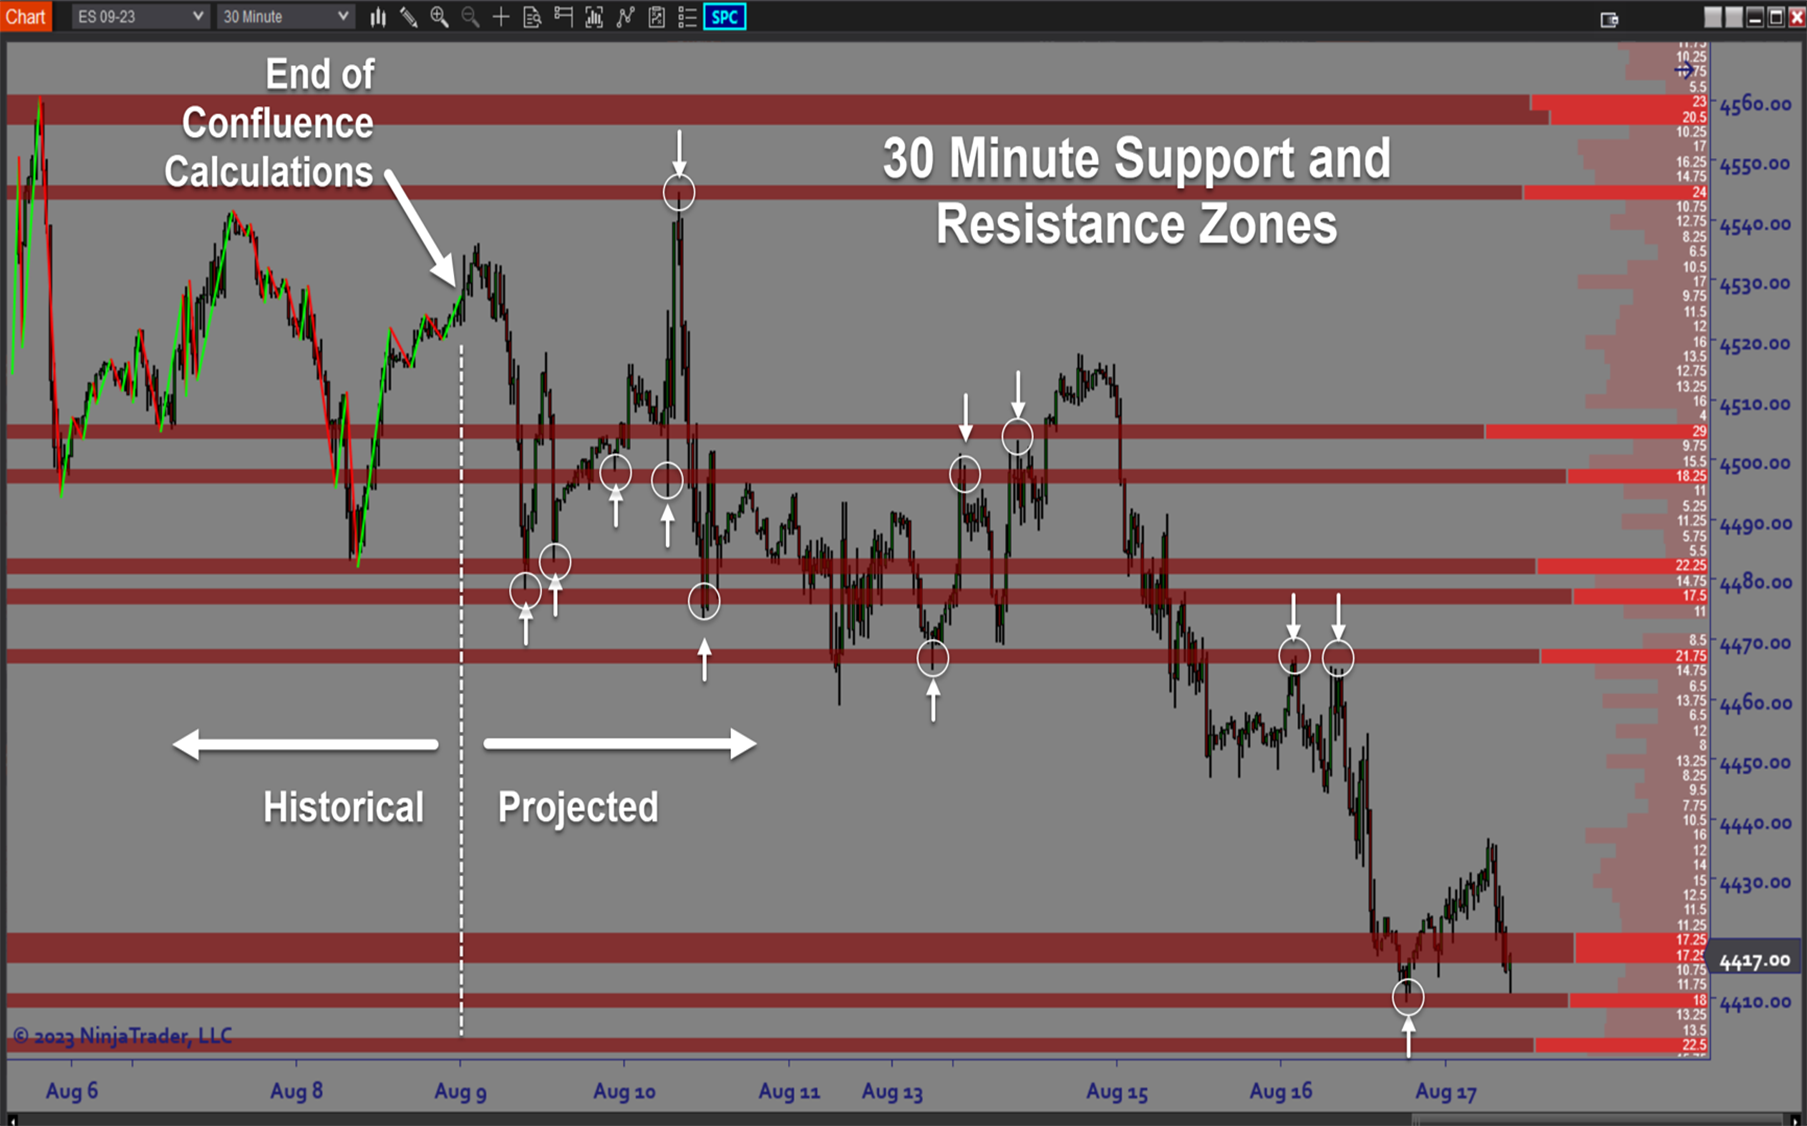
Swing Point Confluence
THIS PRODUCT IS INCLUDED WITH THE ALL-IN-ONE SUBSCRIPTION
- 30+ Proprietary Algos
- 50+ Advanced Indicators
- 4 Complete Trading Systems
- In-Depth User Documentation
- White Glove Installation & Ongoing Support
- Prebuilt Optimized Strategy Templates
- Deep-Dive Video Courses & AMA Sessions
Only for Ninjatrader Platform
Overview:
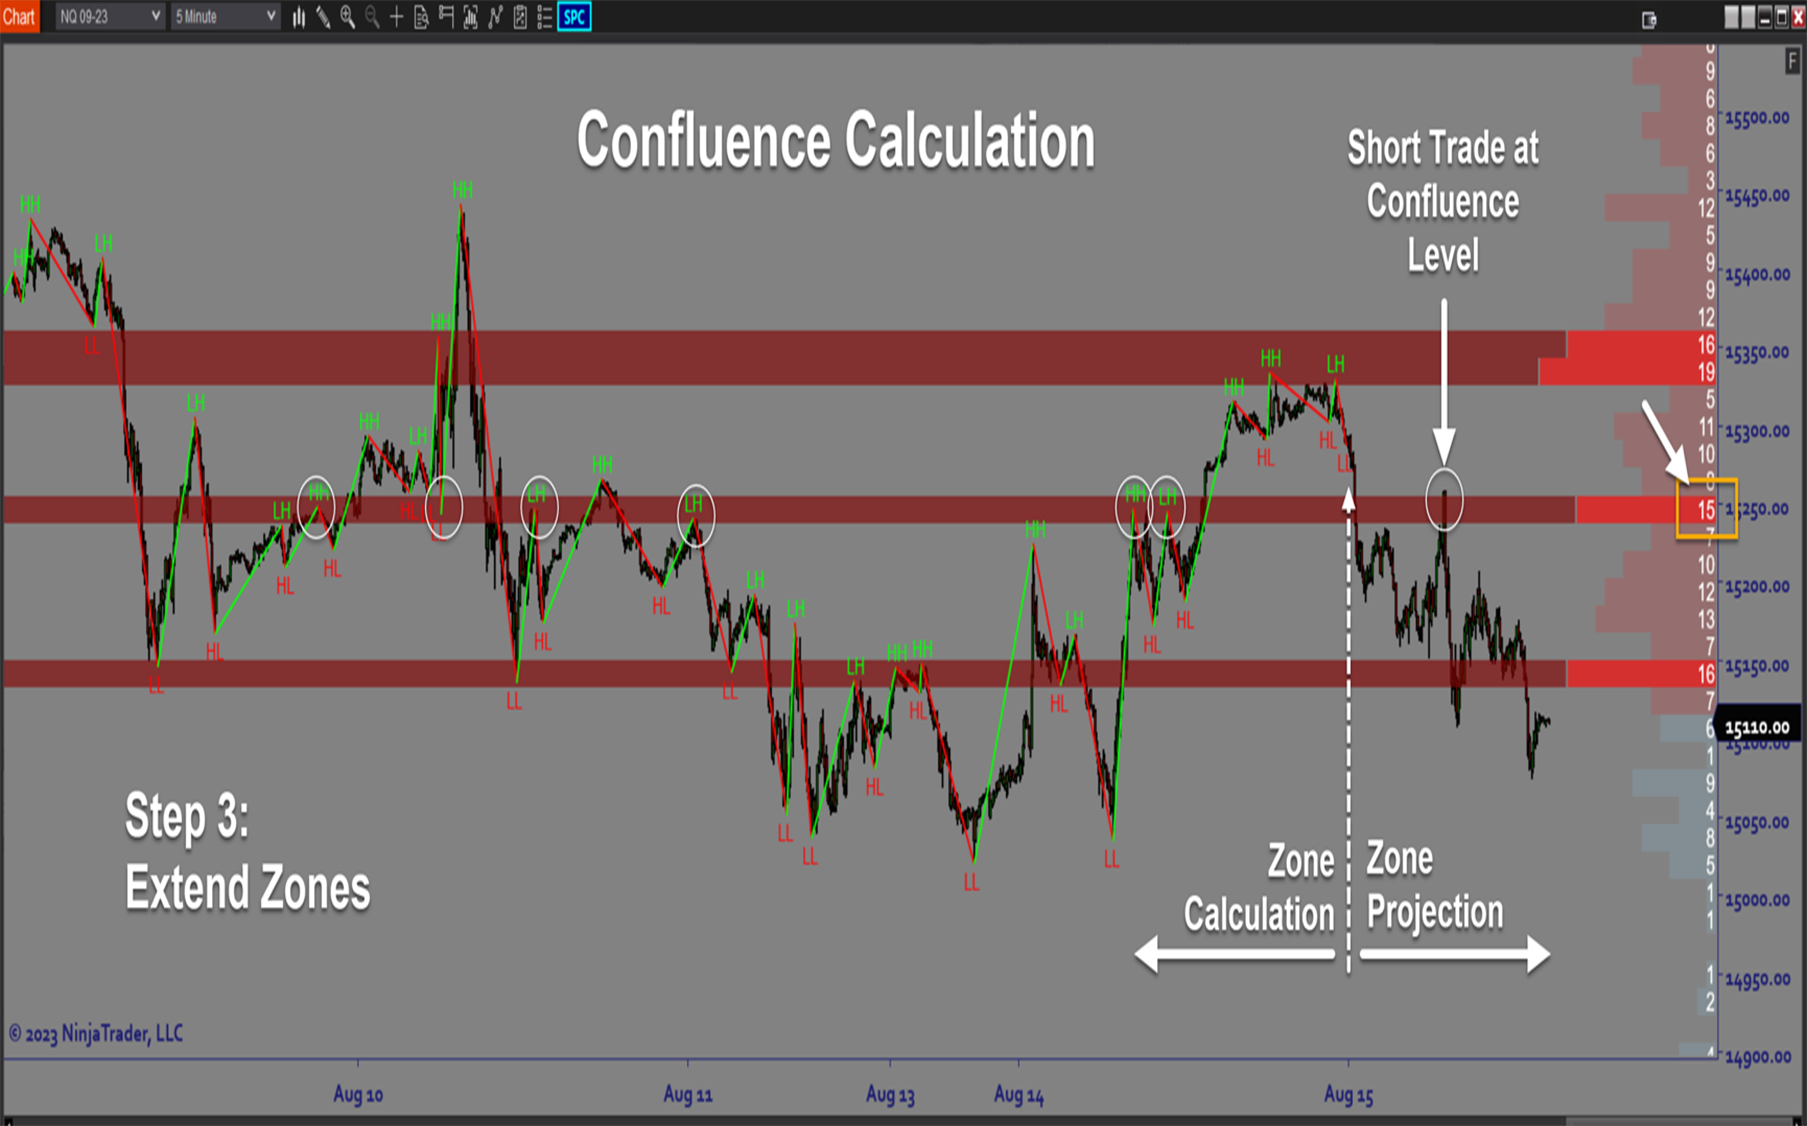
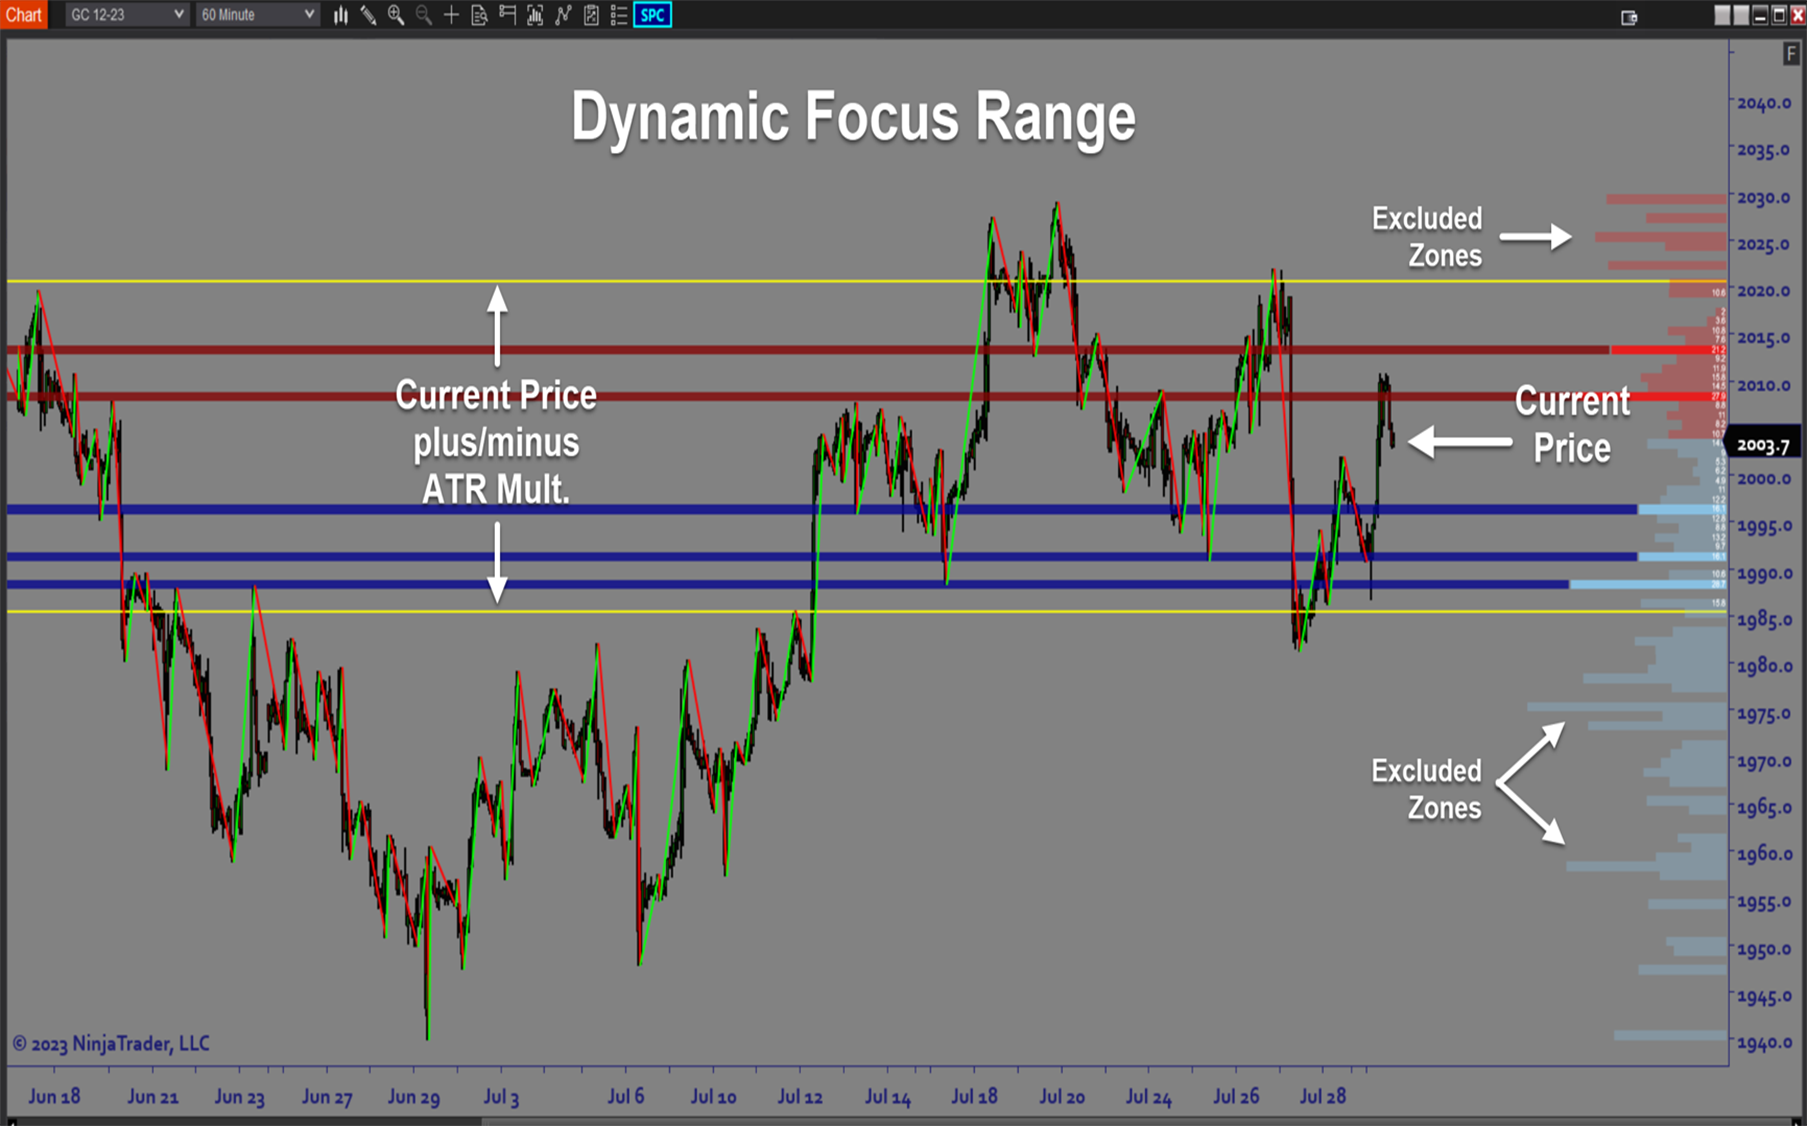
The ARC_SwingPointConfluence software is a price action-based Area of Interest tool which identifies and displays the most important areas of support and resistance on the chart. The displayed levels are derived by looking for confluence areas where price has reacted in the past. These confluence levels are ranked based on a strength index which ensures that only the most important levels will be visible. Customizable Zone size, Strength Filters and Multi-timeframe Swing Point Analysis make this the perfect tool for any trader serious about knowing where key price levels are located.
Purpose:
Traders need the Swing Point Confluence software because the best way to identify important areas of interest is to let historical price action tell you where they are located. Experienced traders can look at a price chart and identify a few obvious levels. But there is no way to visually measure the frequency and size of every price reaction within a specific price range (Zone) and then mathematically determine the strength of the Zone for the purpose of selecting which zones to focus on. The software automatically does all this for you so all you have to do is focus on trading the levels that you see on your chart.
Elements:
- Key Support and Resistance Zones based on swing point confluence
- Automatic Historical Swing Point tracking
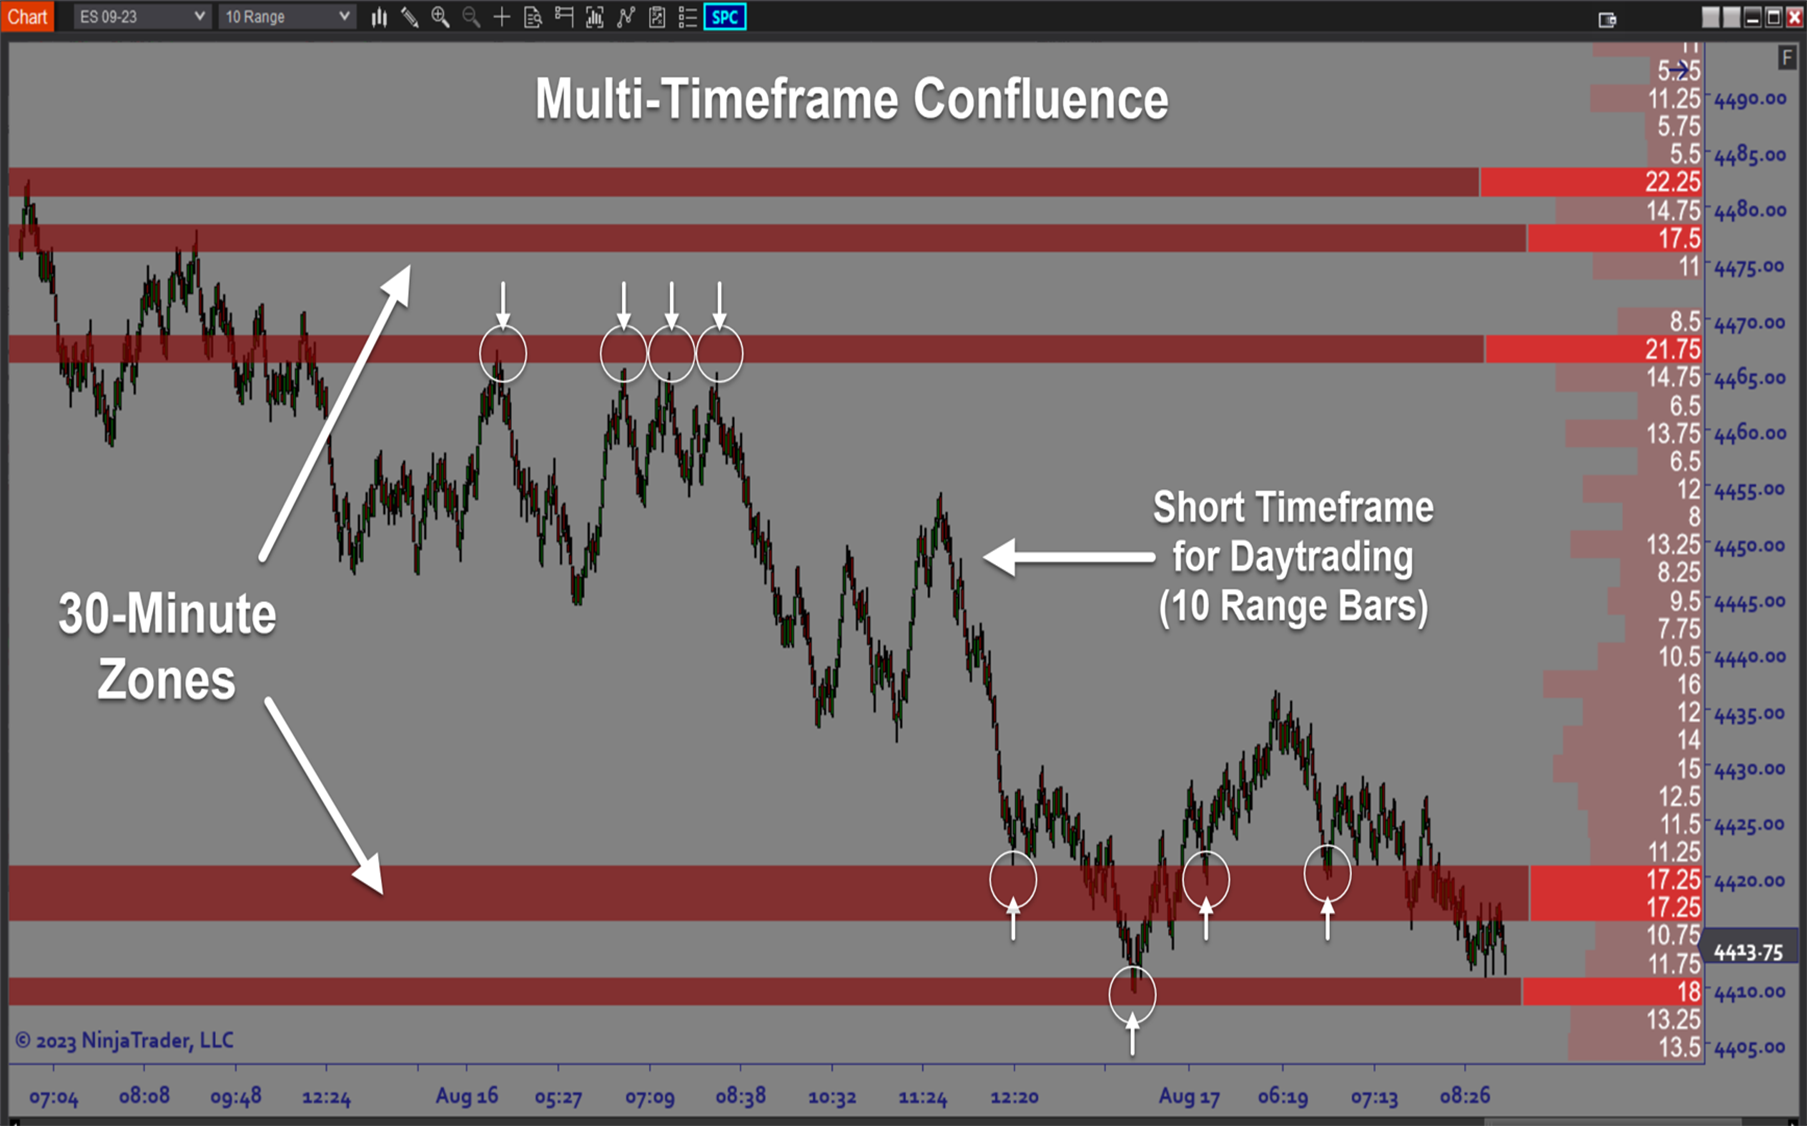
- Multi-timeframe swing point functionality
- Adjustable swing strength setting for Zigzag component
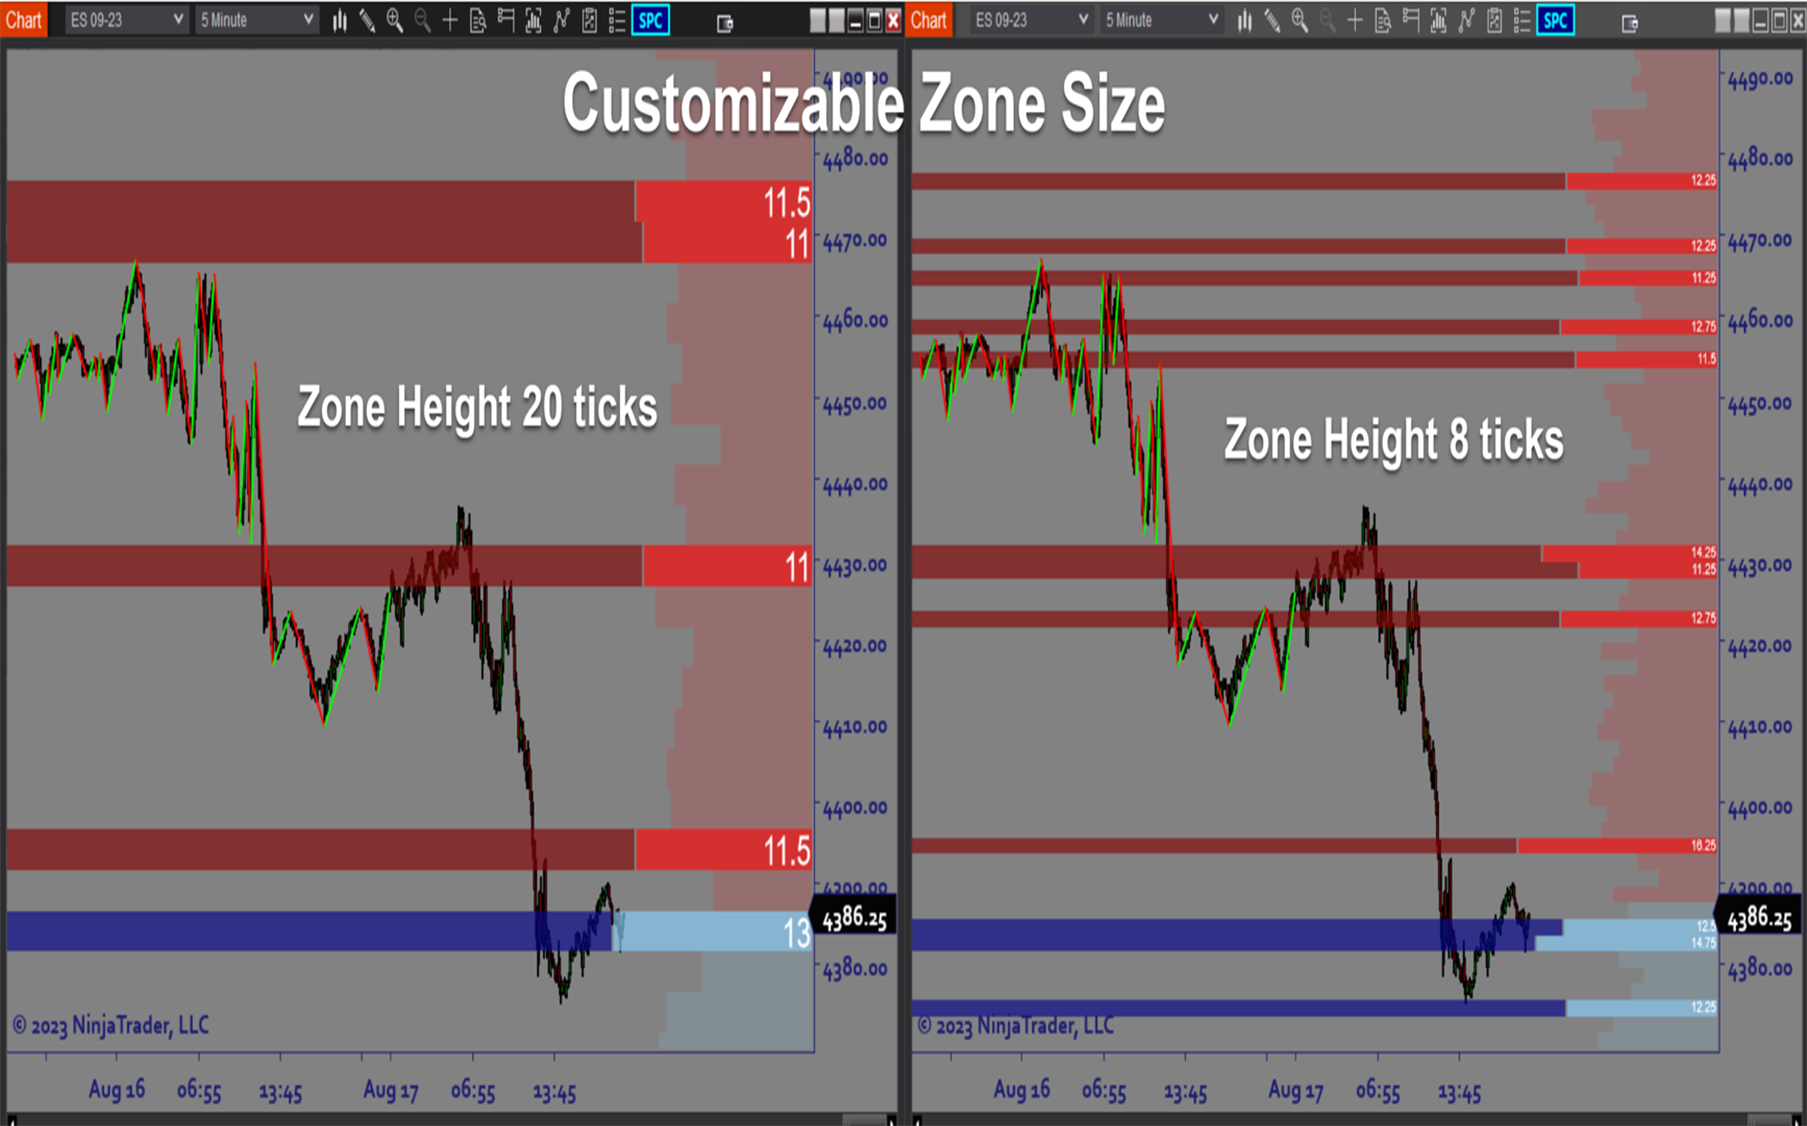
- Customizable Zone size
- Pivot Labels
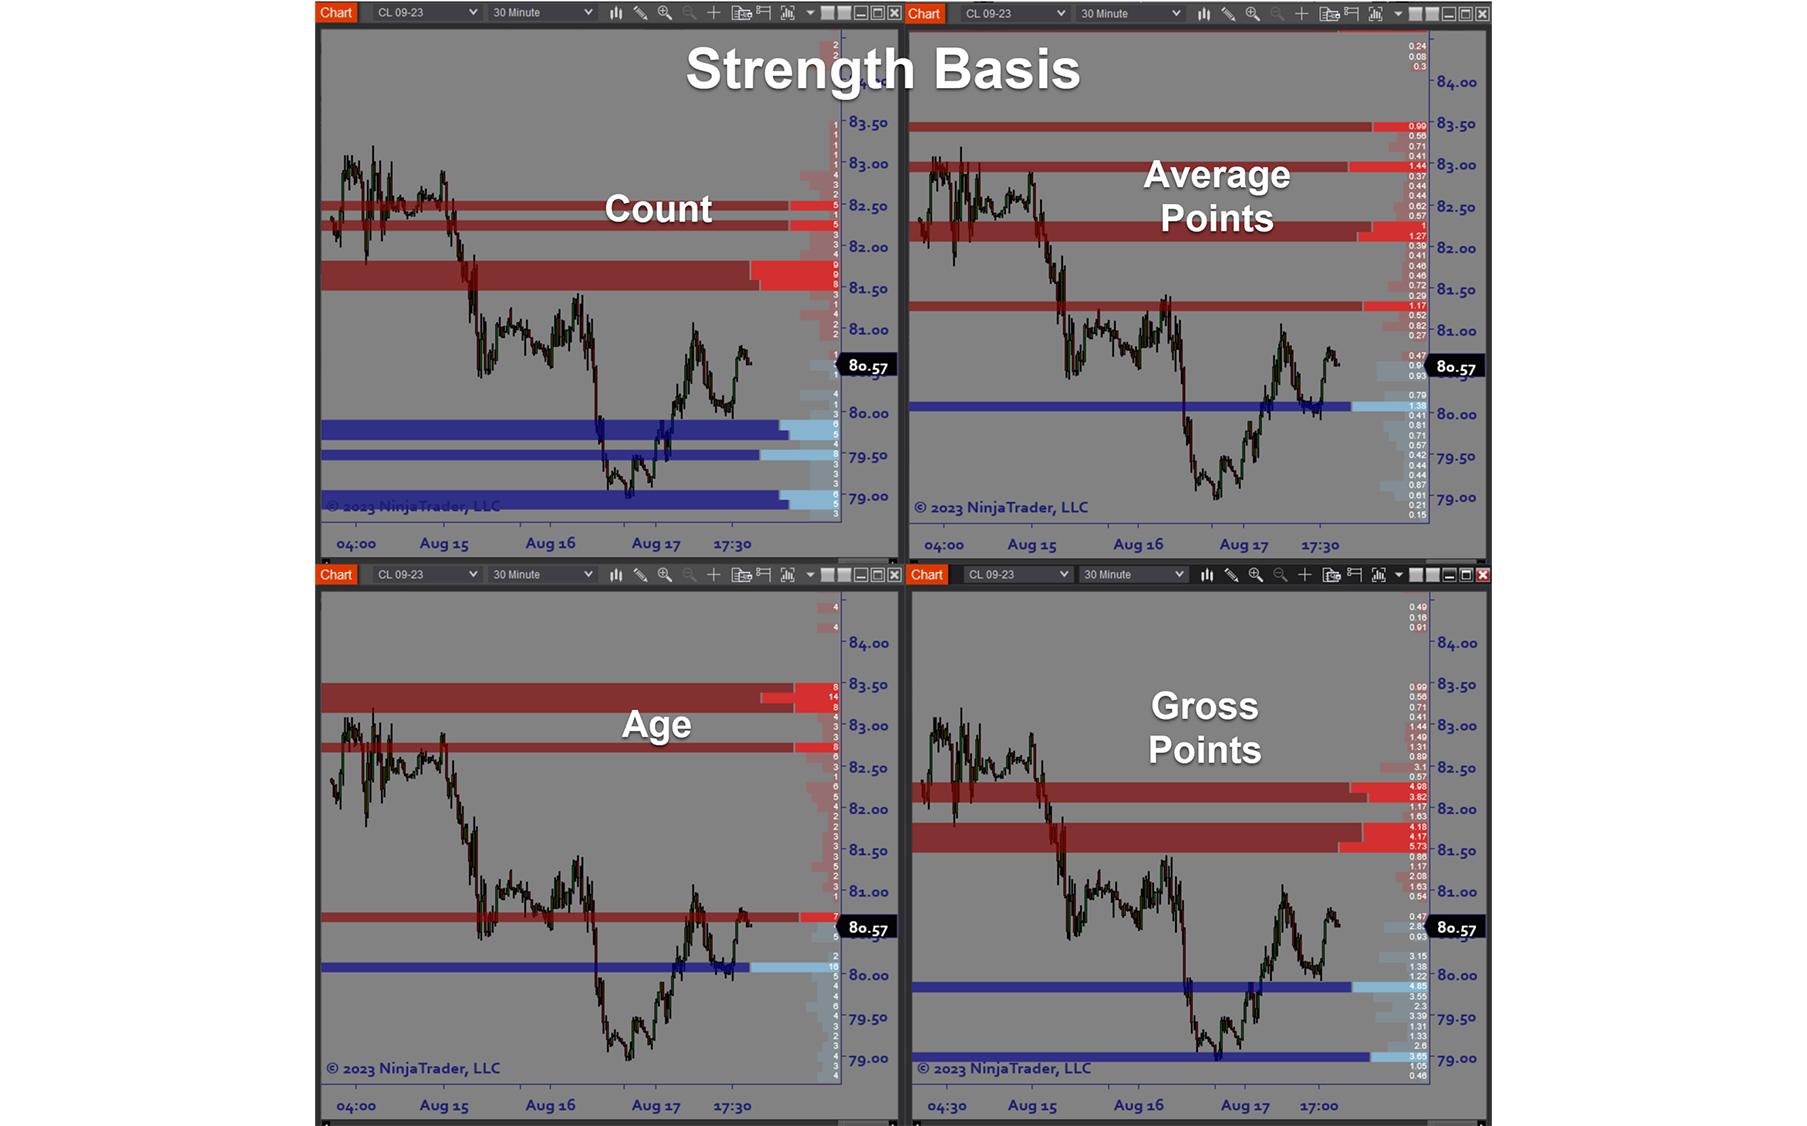
- 4 different Strength Measurement methods
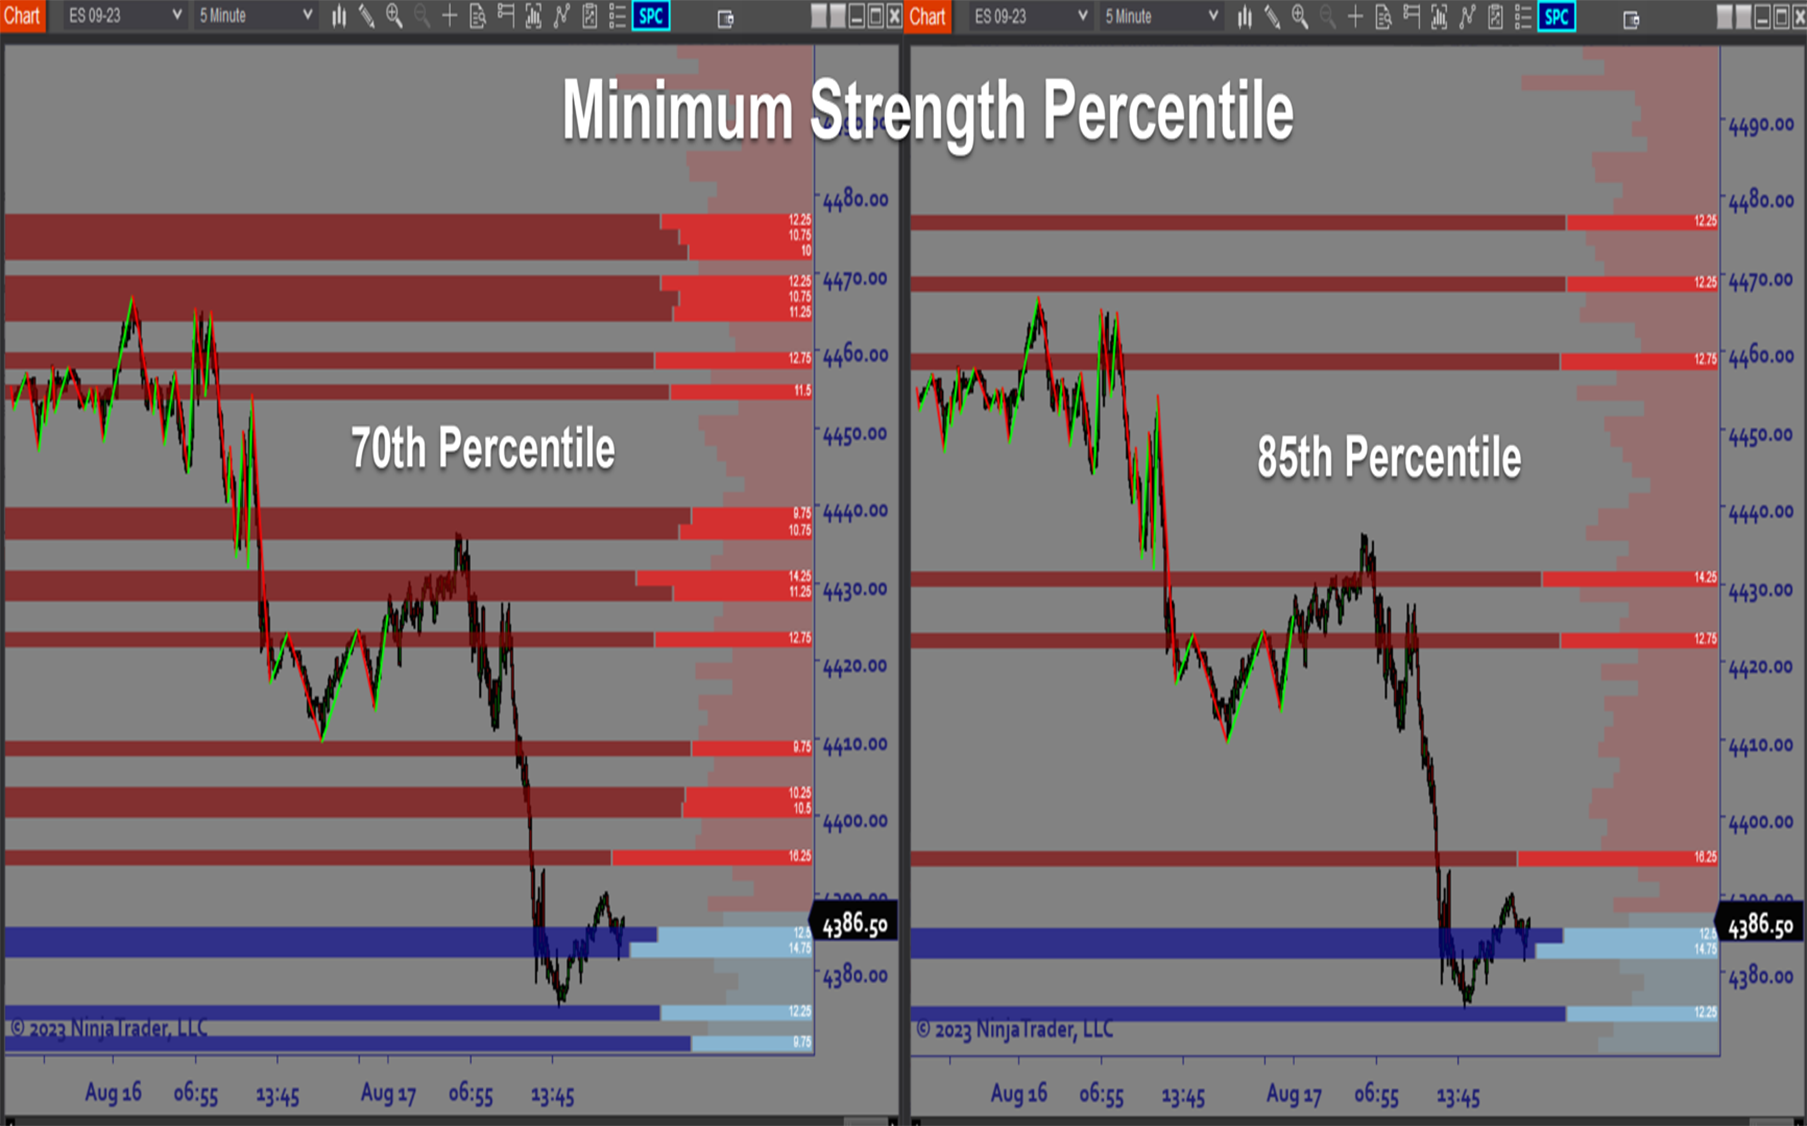
- Percentile Strength Filter
- Strength Histogram including strength labels for each Zone
- User Interface Dropdown menu for only-the-fly parameter adjustment
- Supports any bartype or timeframe
Functions:
The Swing Point Confluence software is best used by applying confluence Zones based on a higher timeframe than your trading chart. This ensures that you get only the strongest Zones. Then a process of fine tuning adjustments such as Zone size and strength Filters helps find the best Zones. Because Zones are derived from historical price action, it is important to make sure you load enough history data to give meaningful results. Once you have the Zones properly added to your trading chart, you will quickly see the benefit of incorporating them into your trading.
Problem Solved:
- Stops traders from second guessing support and resistance
- Stops traders from wasting time manually searching for areas of interest
- Stops traders from trading in the wrong direction
- Stops traders from entering at the wrong location and time
- Stops traders from ignoring higher timeframe market structure
- Stops traders from cutting their winners short
- Stops traders from placing their stops in the wrong locations
- Stops traders from chasing the market
- Stops traders from cutting their winners short


