Volatility Index
THIS PRODUCT IS INCLUDED WITH THE ALL-IN-ONE SUBSCRIPTION
- 30+ Proprietary Algos
- 50+ Advanced Indicators
- 4 Complete Trading Systems
- In-Depth User Documentation
- White Glove Installation & Ongoing Support
- Prebuilt Optimized Strategy Templates
- Deep-Dive Video Courses & AMA Sessions
Only for Ninjatrader Platform
This indicator is part of our Annual Indicators Membership.
To access this indicator for free, please click the link below.
Volatility Indicator Overview:
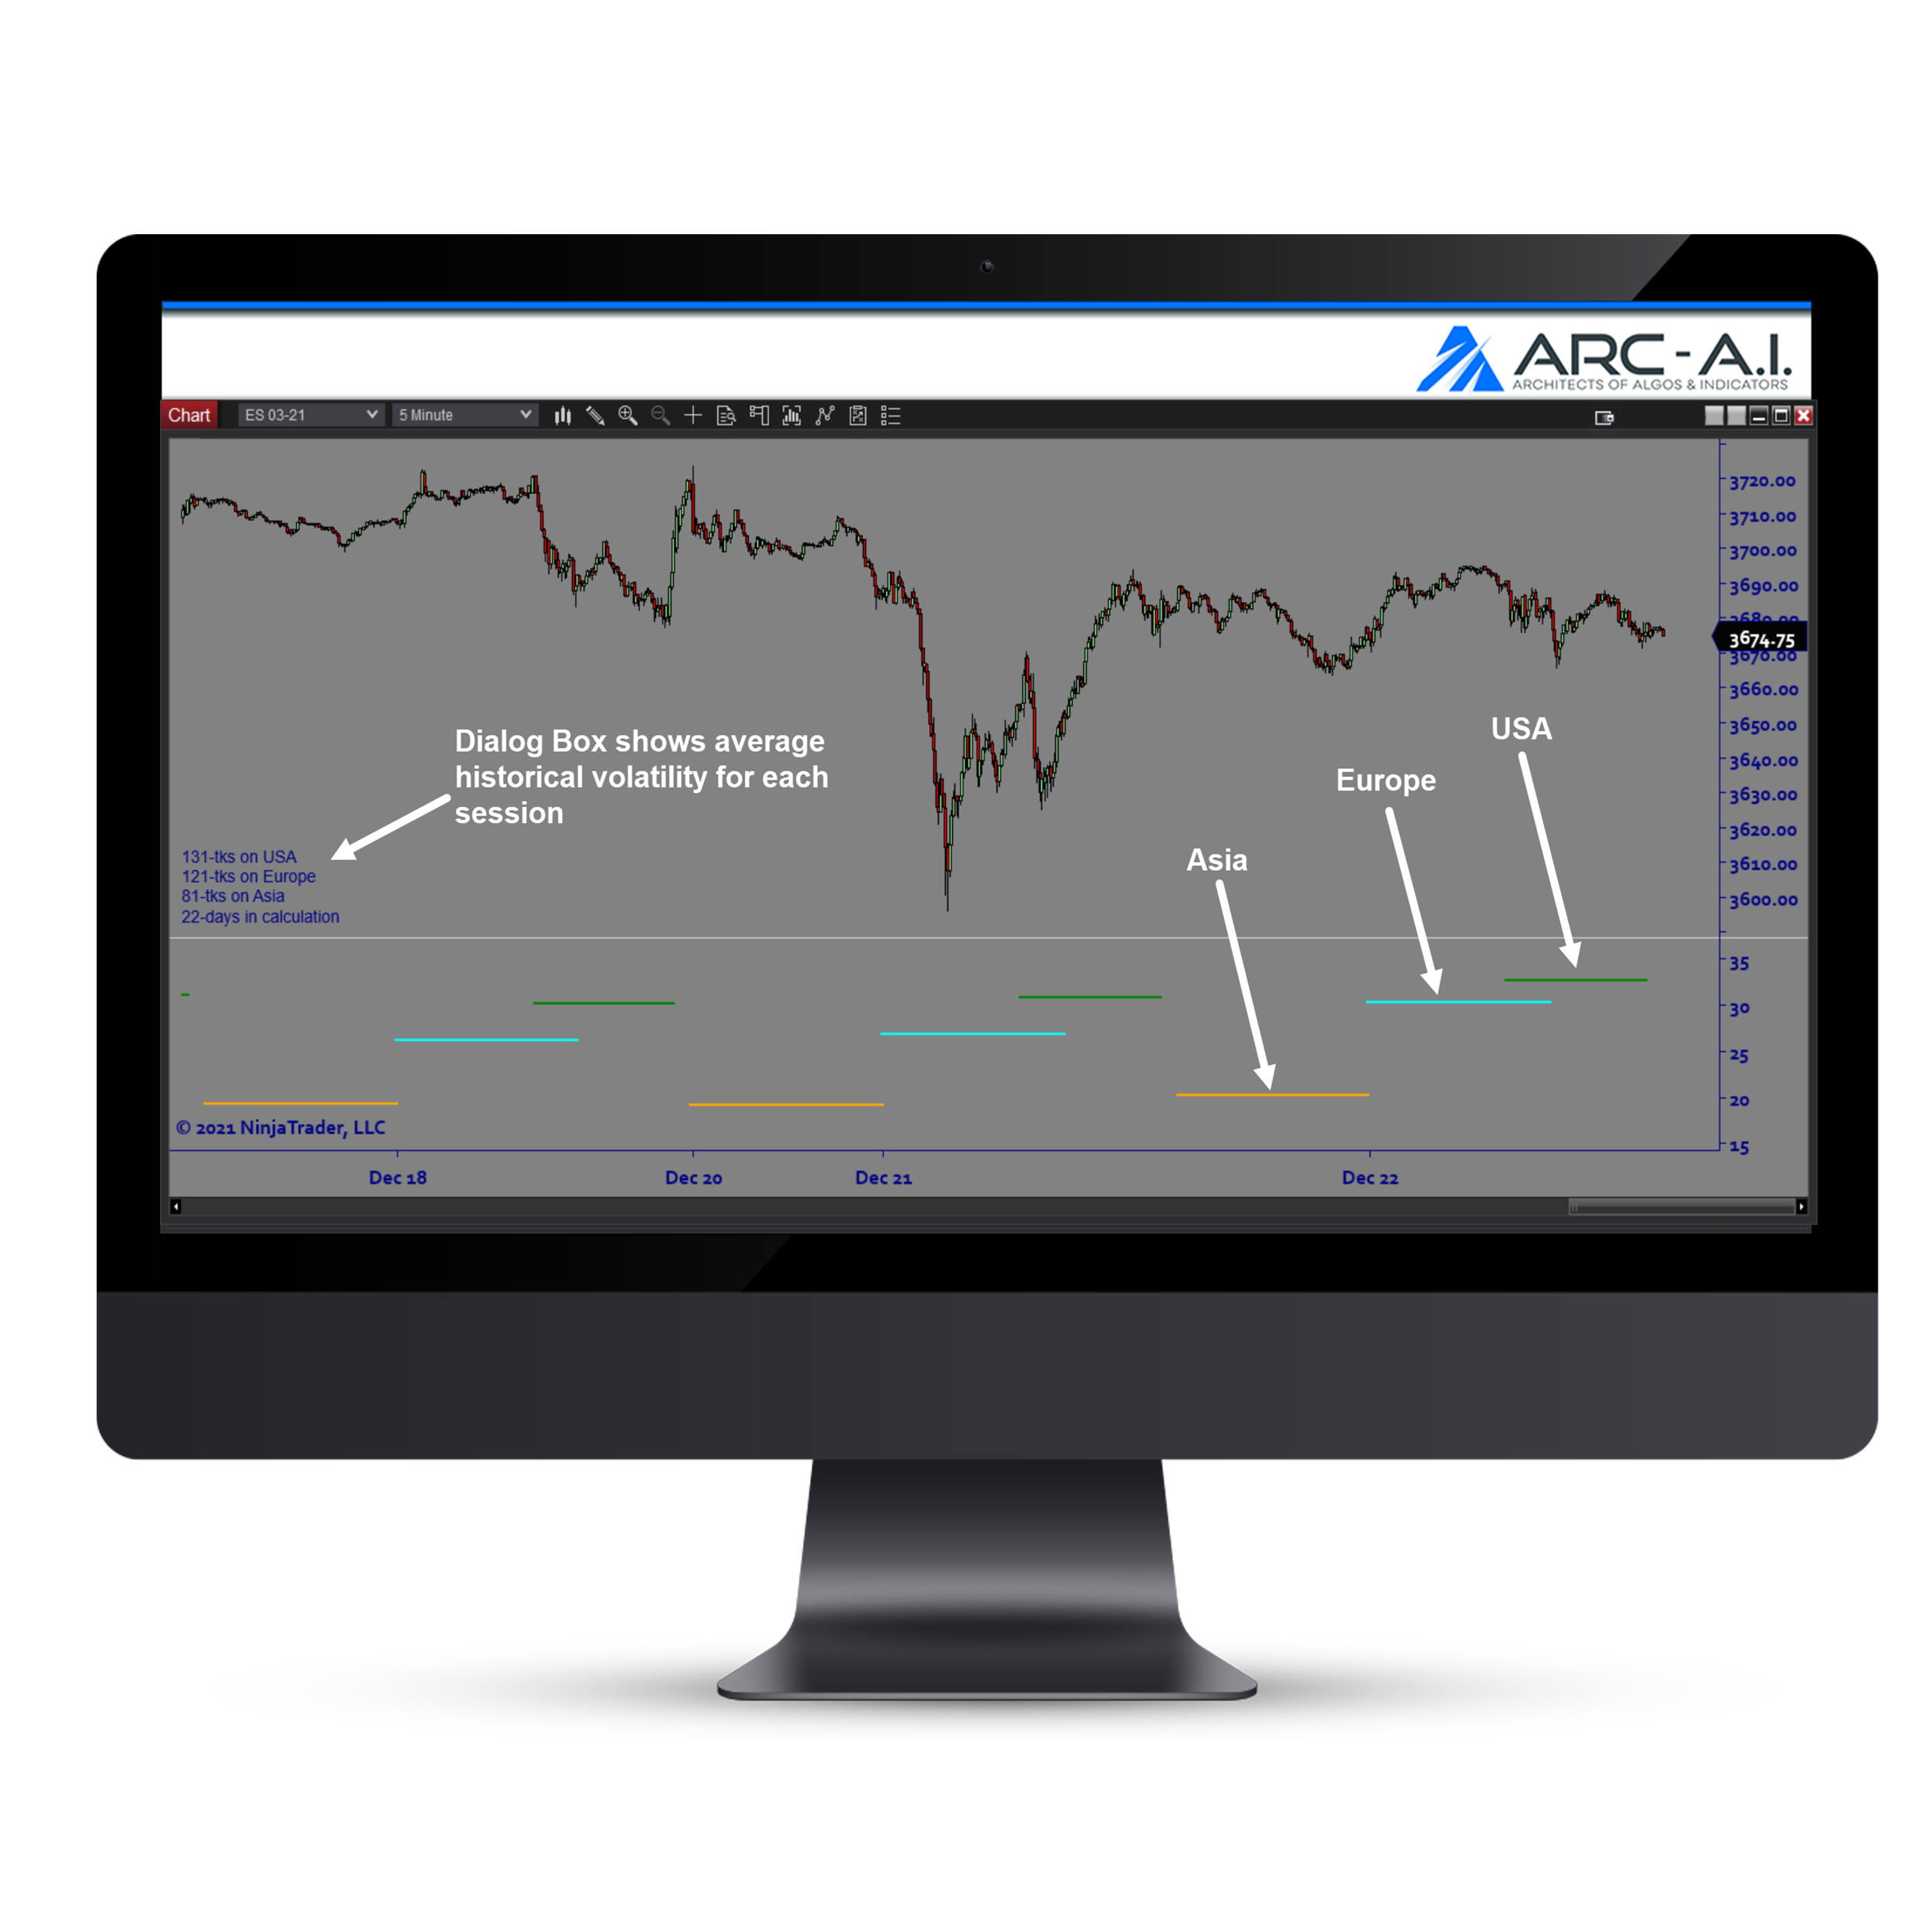
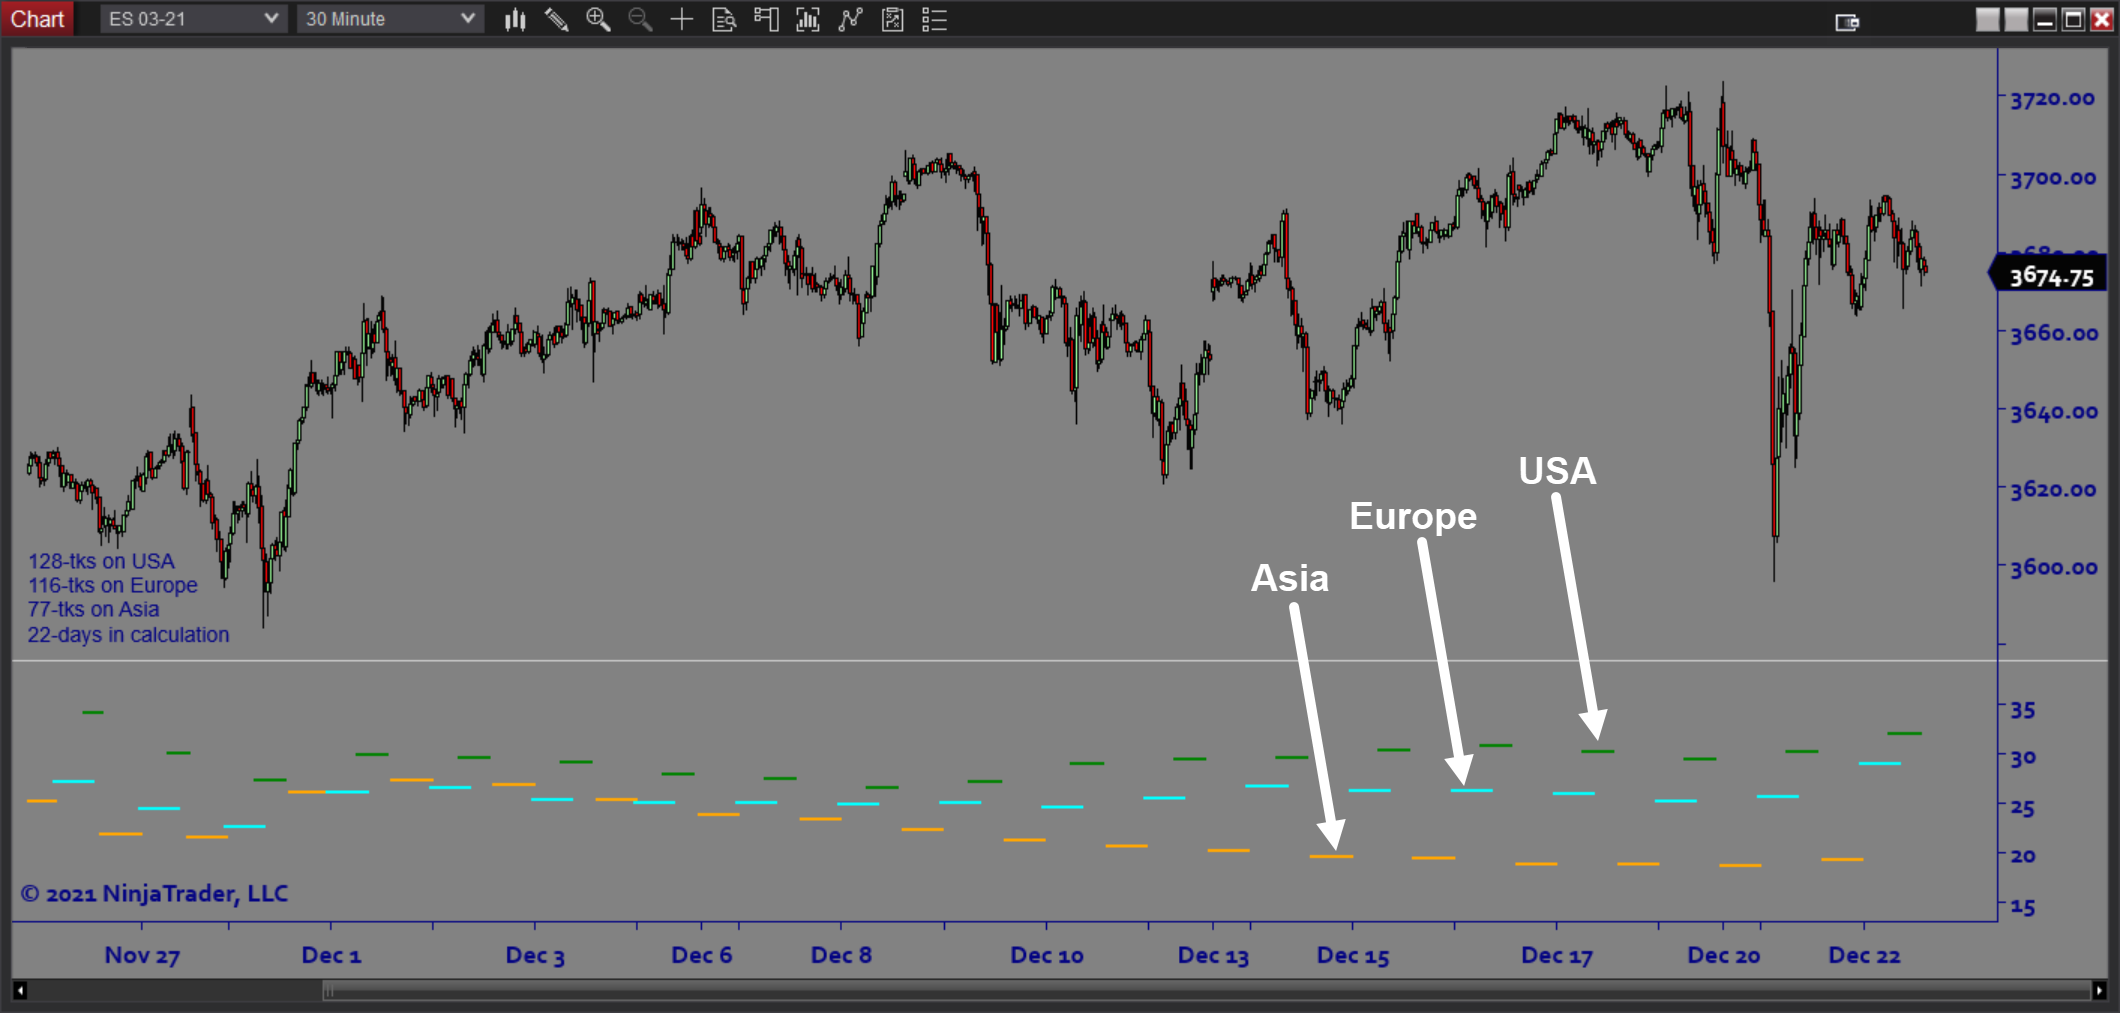
The Vol Index is a statistical volatility tool that calculates average range data for global markets. The purpose is to differentiate the average expected range for each trading session (US, Europe, and Asia). Based on the time of day that you are trading , it is important to know what to expect so you stay in tune with market dynamics.
Purpose:
Traders need the Volatility Index indicator because traders should always remain aware of changes in market conditions. The software isolates each of the 3 global trading session when calculating average volatility so that you can focus on the most relevant data.
Elements:
- Historical Average Trading Ranges for US, European, and Asian trading sessions
- Customizable Lookback Period
- Average Range Data Info Box
Functions:
The Volatility Index software is best used during the planning stages of your trading day. You always want to be aware of any sudden changes in volatility conditions so that you are prepared. Periodically checking for any changes throughout the day is also advisable.
Problem Solved with our Volatility Indicator:
- Stops traders from losing sight of important market conditions
- Stops traders from getting in at the wrong time
- Stops traders from second guessing relative volatility
- Stops traders from ignoring intraday seasonal patterns


