Critical Averages – Daily Range Detection Indicator
THIS PRODUCT IS INCLUDED WITH THE ALL-IN-ONE SUBSCRIPTION
- 30+ Proprietary Algos
- 50+ Advanced Indicators
- 4 Complete Trading Systems
- In-Depth User Documentation
- White Glove Installation & Ongoing Support
- Prebuilt Optimized Strategy Templates
- Deep-Dive Video Courses & AMA Sessions
Only for Ninjatrader Platform
This indicator is part of our Annual Indicators Membership.
To access this indicator for free, please click the link below.
Overview:
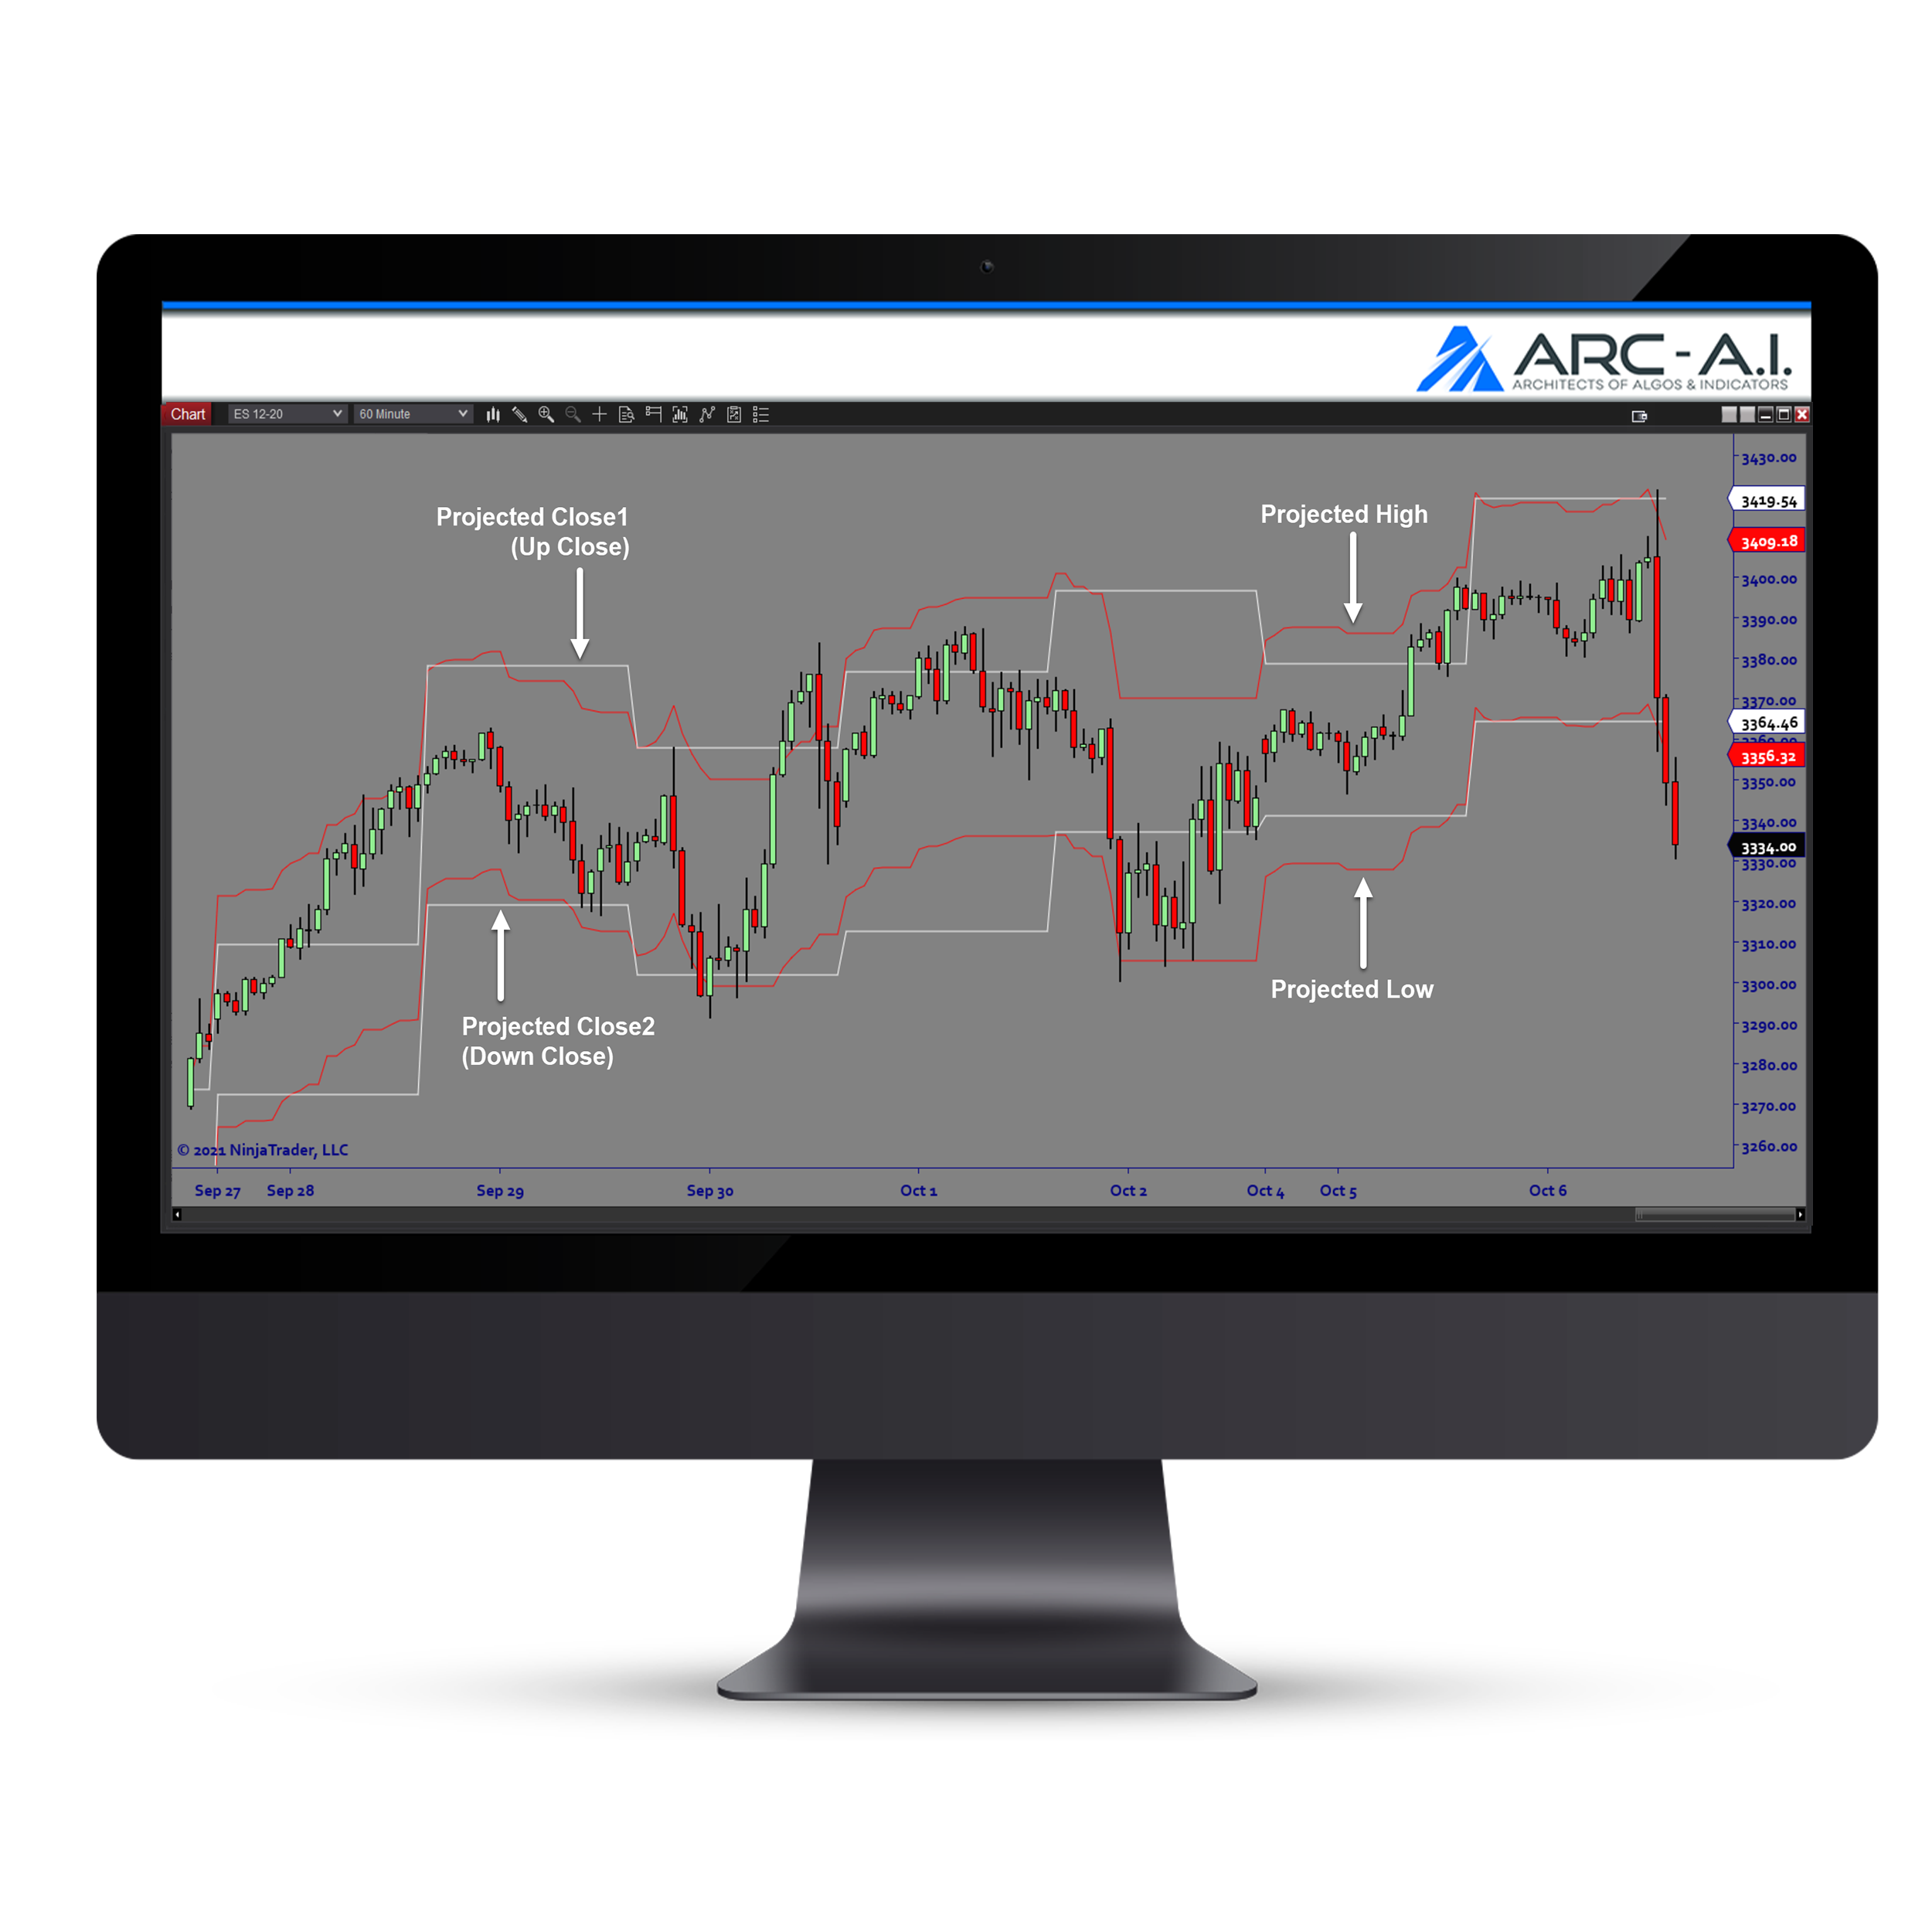
NS_CriticalAverages is a daily range detection indicator that identifies the average daily range as well as the projected close for the day. It can be very useful to know where the market is likely to trade if price action remains consistent with historical average volatility. This provides traders with important areas of interest that should not be ignored.
Purpose:
Traders need the Critical Averages software to remain aware of the anticipated playing field for the current day’s price action. The software plots upper and lower lines on the chart reflecting projected trading range. When prices expand out of this range, this can signal a shift to a trending environment.
Elements:
- Projected Daily High/Low
- Projected Close (both Up Close and Down Close)
- Projections based on Historical Volatility
- Customizable Lookback Period
Functions:
The Critical Averages software is best used by plotting the projected range boundary lines on your trading chart so that you remain aware of important areas of interest. If price respects these levels, it implies an oscillating environment. Breakouts of the range signify a potential move to a new area of equilibrium.
Problem Solved:
- Stops traders from ignoring market context
- Stops Traders from missing important support and resistance levels
- Stops traders from second guessing trending and oscillating conditions
- Stops traders from getting in at the wrong time or place


