ATR Forecaster. Market Forecast Indicator
THIS PRODUCT IS INCLUDED WITH THE ALL-IN-ONE SUBSCRIPTION
- 30+ Proprietary Algos
- 50+ Advanced Indicators
- 4 Complete Trading Systems
- In-Depth User Documentation
- White Glove Installation & Ongoing Support
- Prebuilt Optimized Strategy Templates
- Deep-Dive Video Courses & AMA Sessions
Only for Ninjatrader Platform
ATR Forecaster. Market Forecast Indicator Overview:
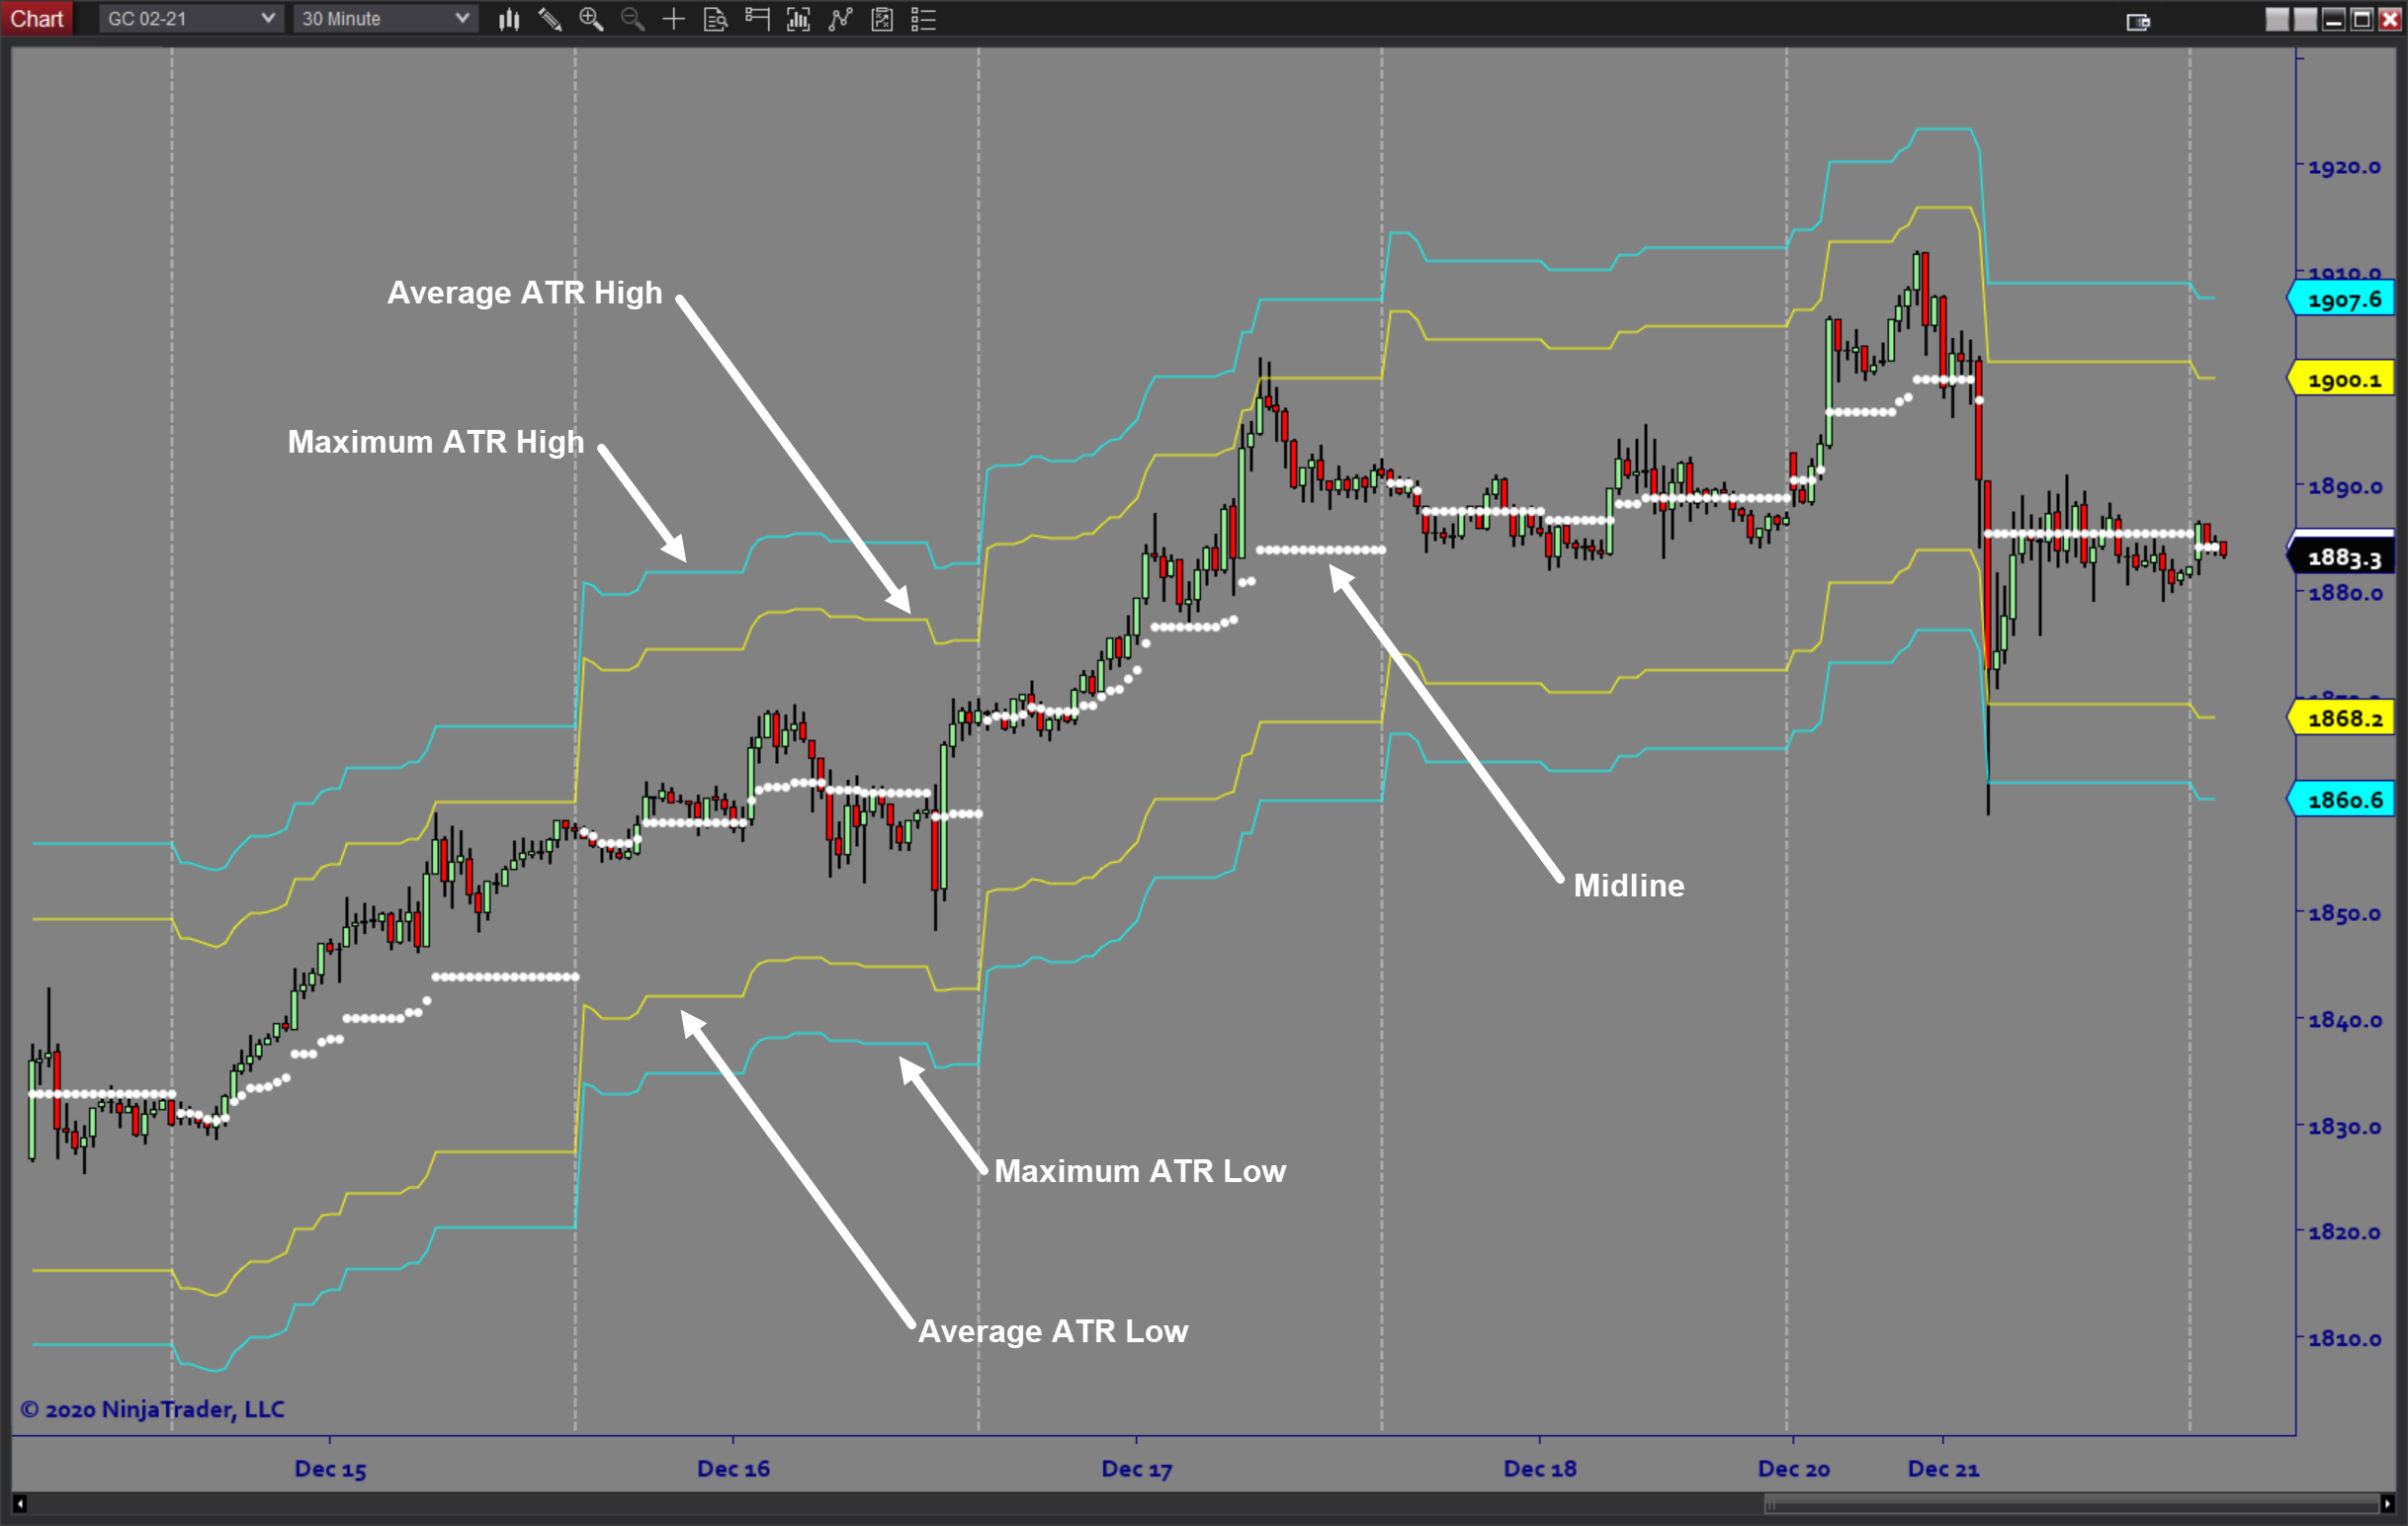
The ATRForecaster is a Market Forecast software helps answer the question “what is the expected trading range for the day?”. If today’s volatility is similar to the recent average then we can set the upper and lower expected boundaries for today’s trading range. Being statistically derived, these are important levels. The software plots these boundaries on your chart for easy reference. Prior days boundary lines are also displayed for historical context.
Purpose:
Traders need the ATR Forecaster because understanding what the statistically expected trading range for the day is important knowledge when considering entry location. Traders should always remain aware of where the market is trading in relation to these key Support and Resistance levels.
The displayed levels provide important context for trading decisions.
Elements:
- ATR based Average Volatility
- Projected Range based on historical volatility
- User defined lookback period
- Average and Maximum Range Boundaries
- Projected Range Updated Daily
- Dynamic or Fixed Daily Levels
- Optional Midline
Functions:
The ATR Forecaster is best used by adding the upper and lower boundary lines on your trading chart so that you can easily see where they are when you are trading. You can show both the average and maximum anticipated range based on ATR lookbacks. When price gets near a boundary, whether it holds or not will tell you a lot about trending conditions.
Problem Solved with our Market Forecast Indicator:
- Stops Traders from missing important support and resistance
- Stops traders from ignoring market context
- Stops traders from second guessing trending and oscillating conditions
- Stops traders from getting in at the wrong time or place
- Stops traders from getting stopped out for no apparent reason


