HTF Averages
THIS PRODUCT IS INCLUDED WITH THE ALL-IN-ONE SUBSCRIPTION
- 30+ Proprietary Algos
- 50+ Advanced Indicators
- 4 Complete Trading Systems
- In-Depth User Documentation
- White Glove Installation & Ongoing Support
- Prebuilt Optimized Strategy Templates
- Deep-Dive Video Courses & AMA Sessions
Only for Ninjatrader Platform
Overview:
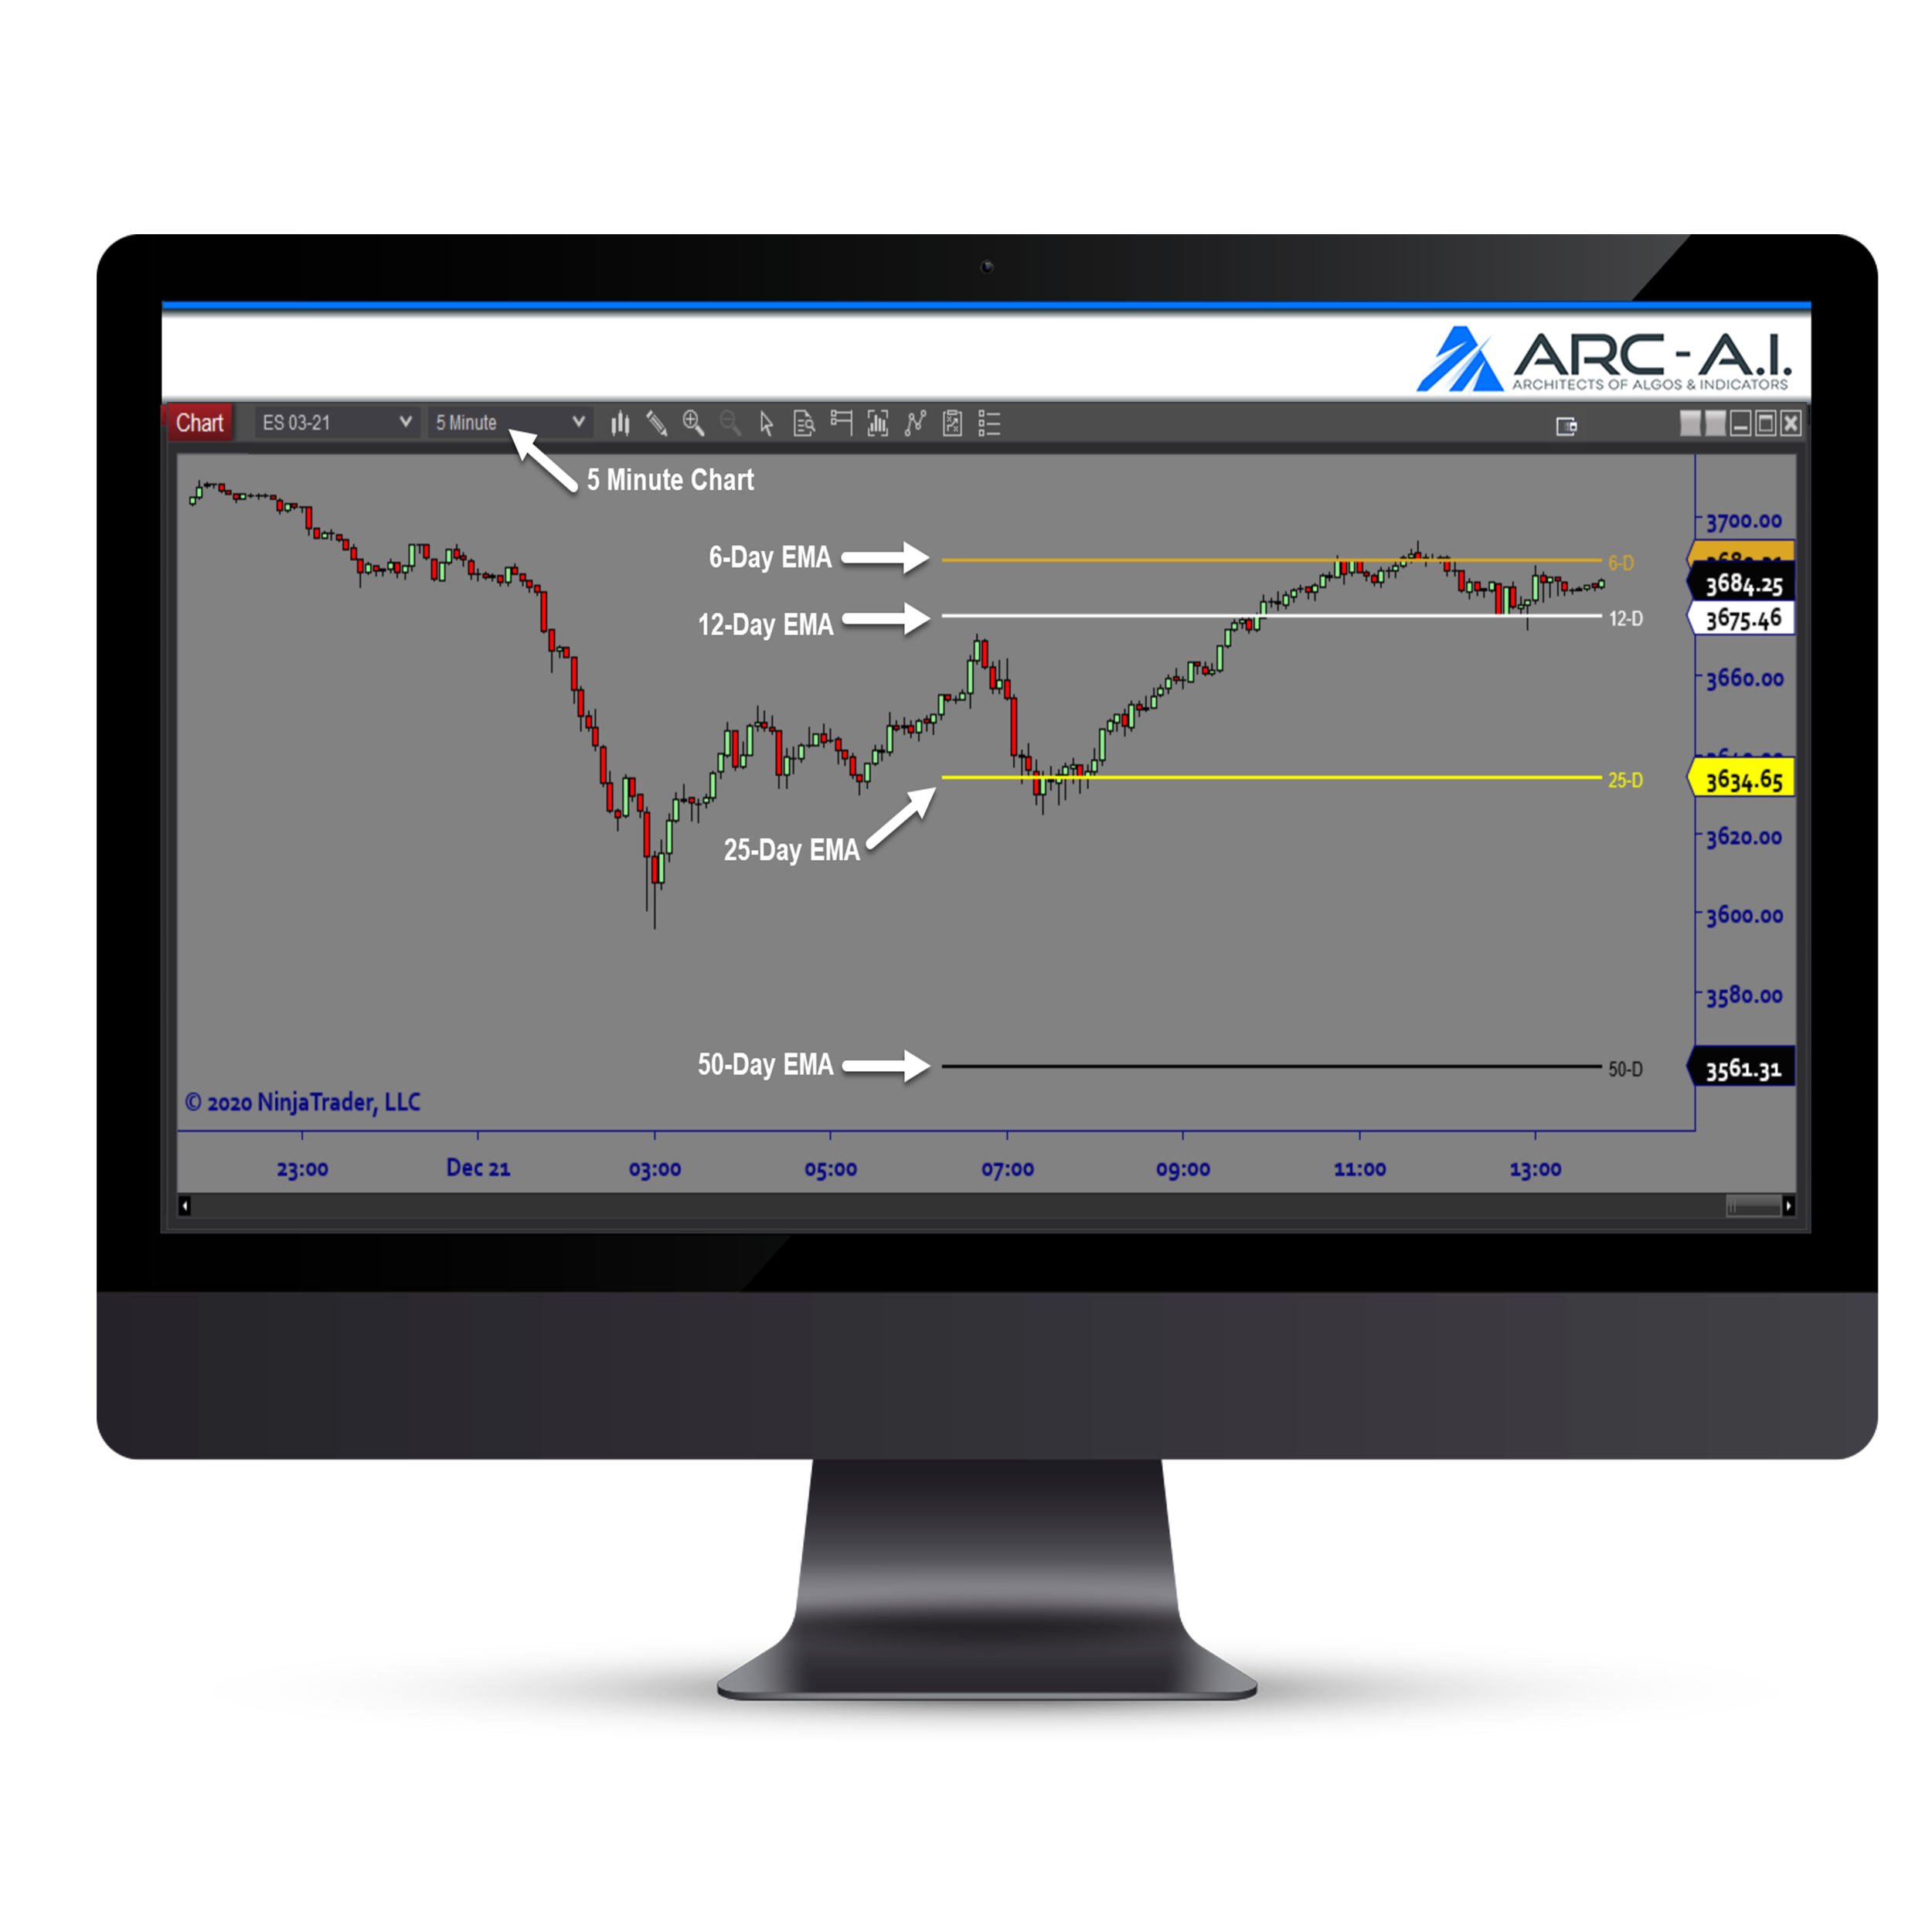
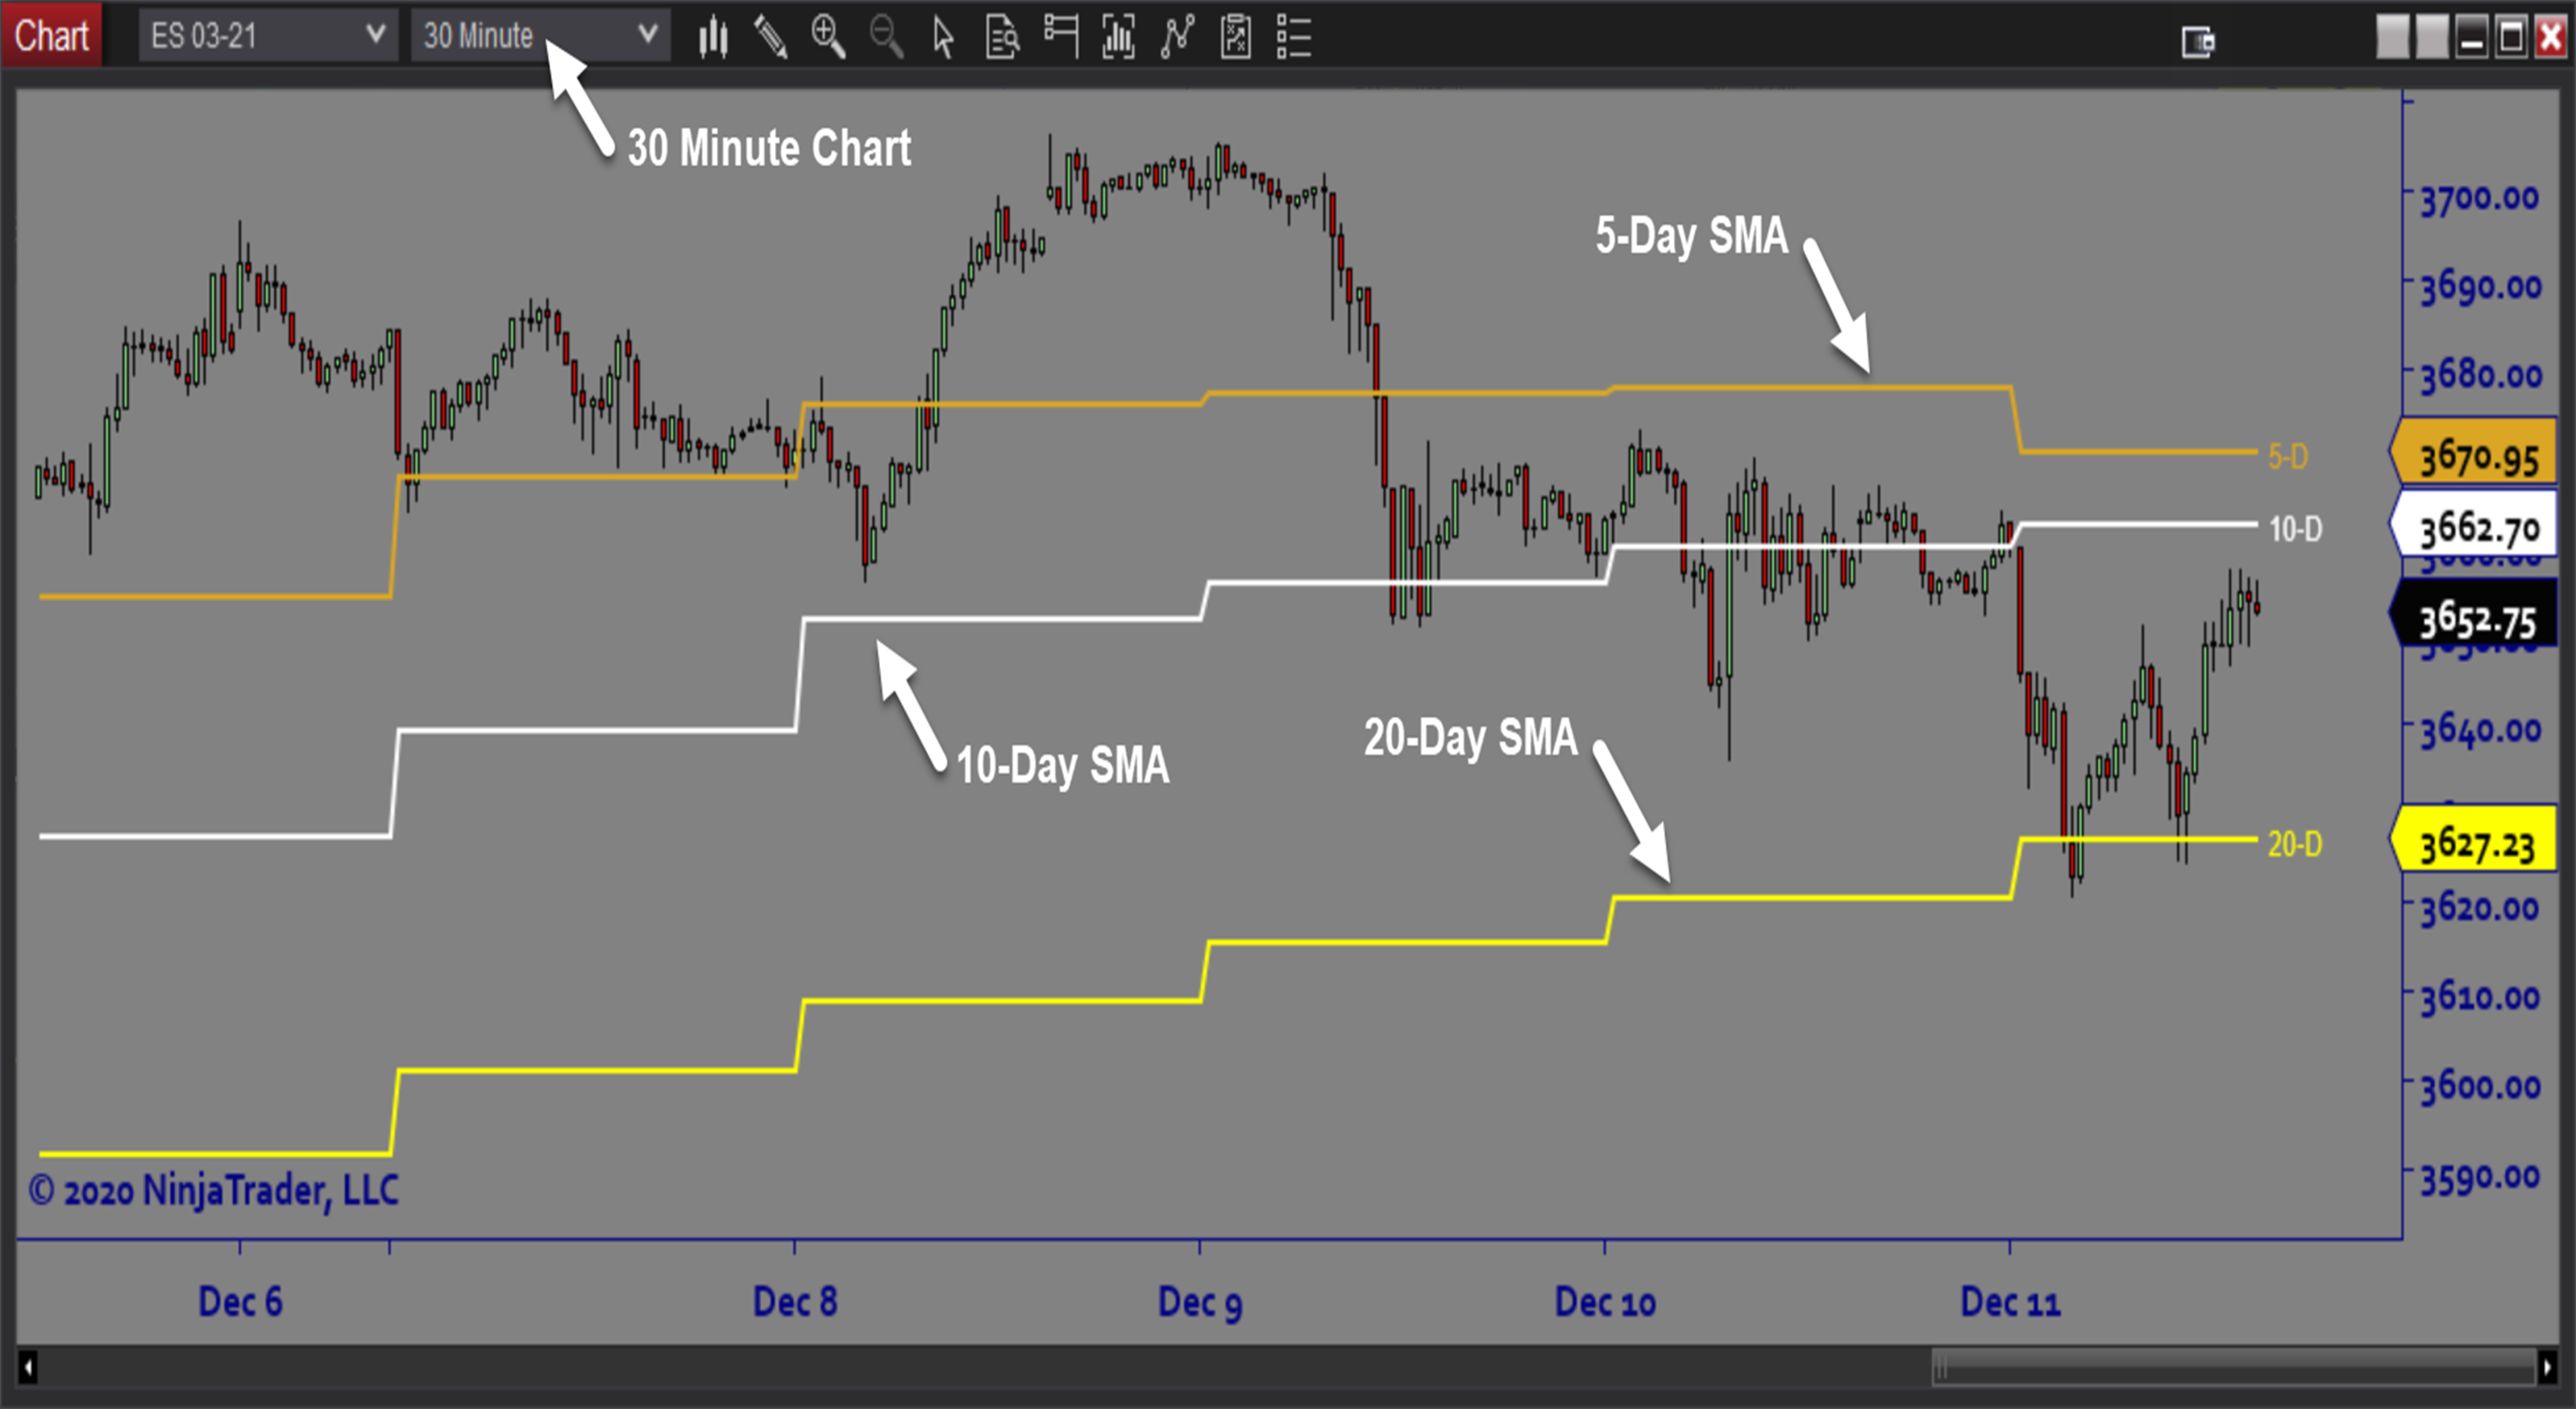
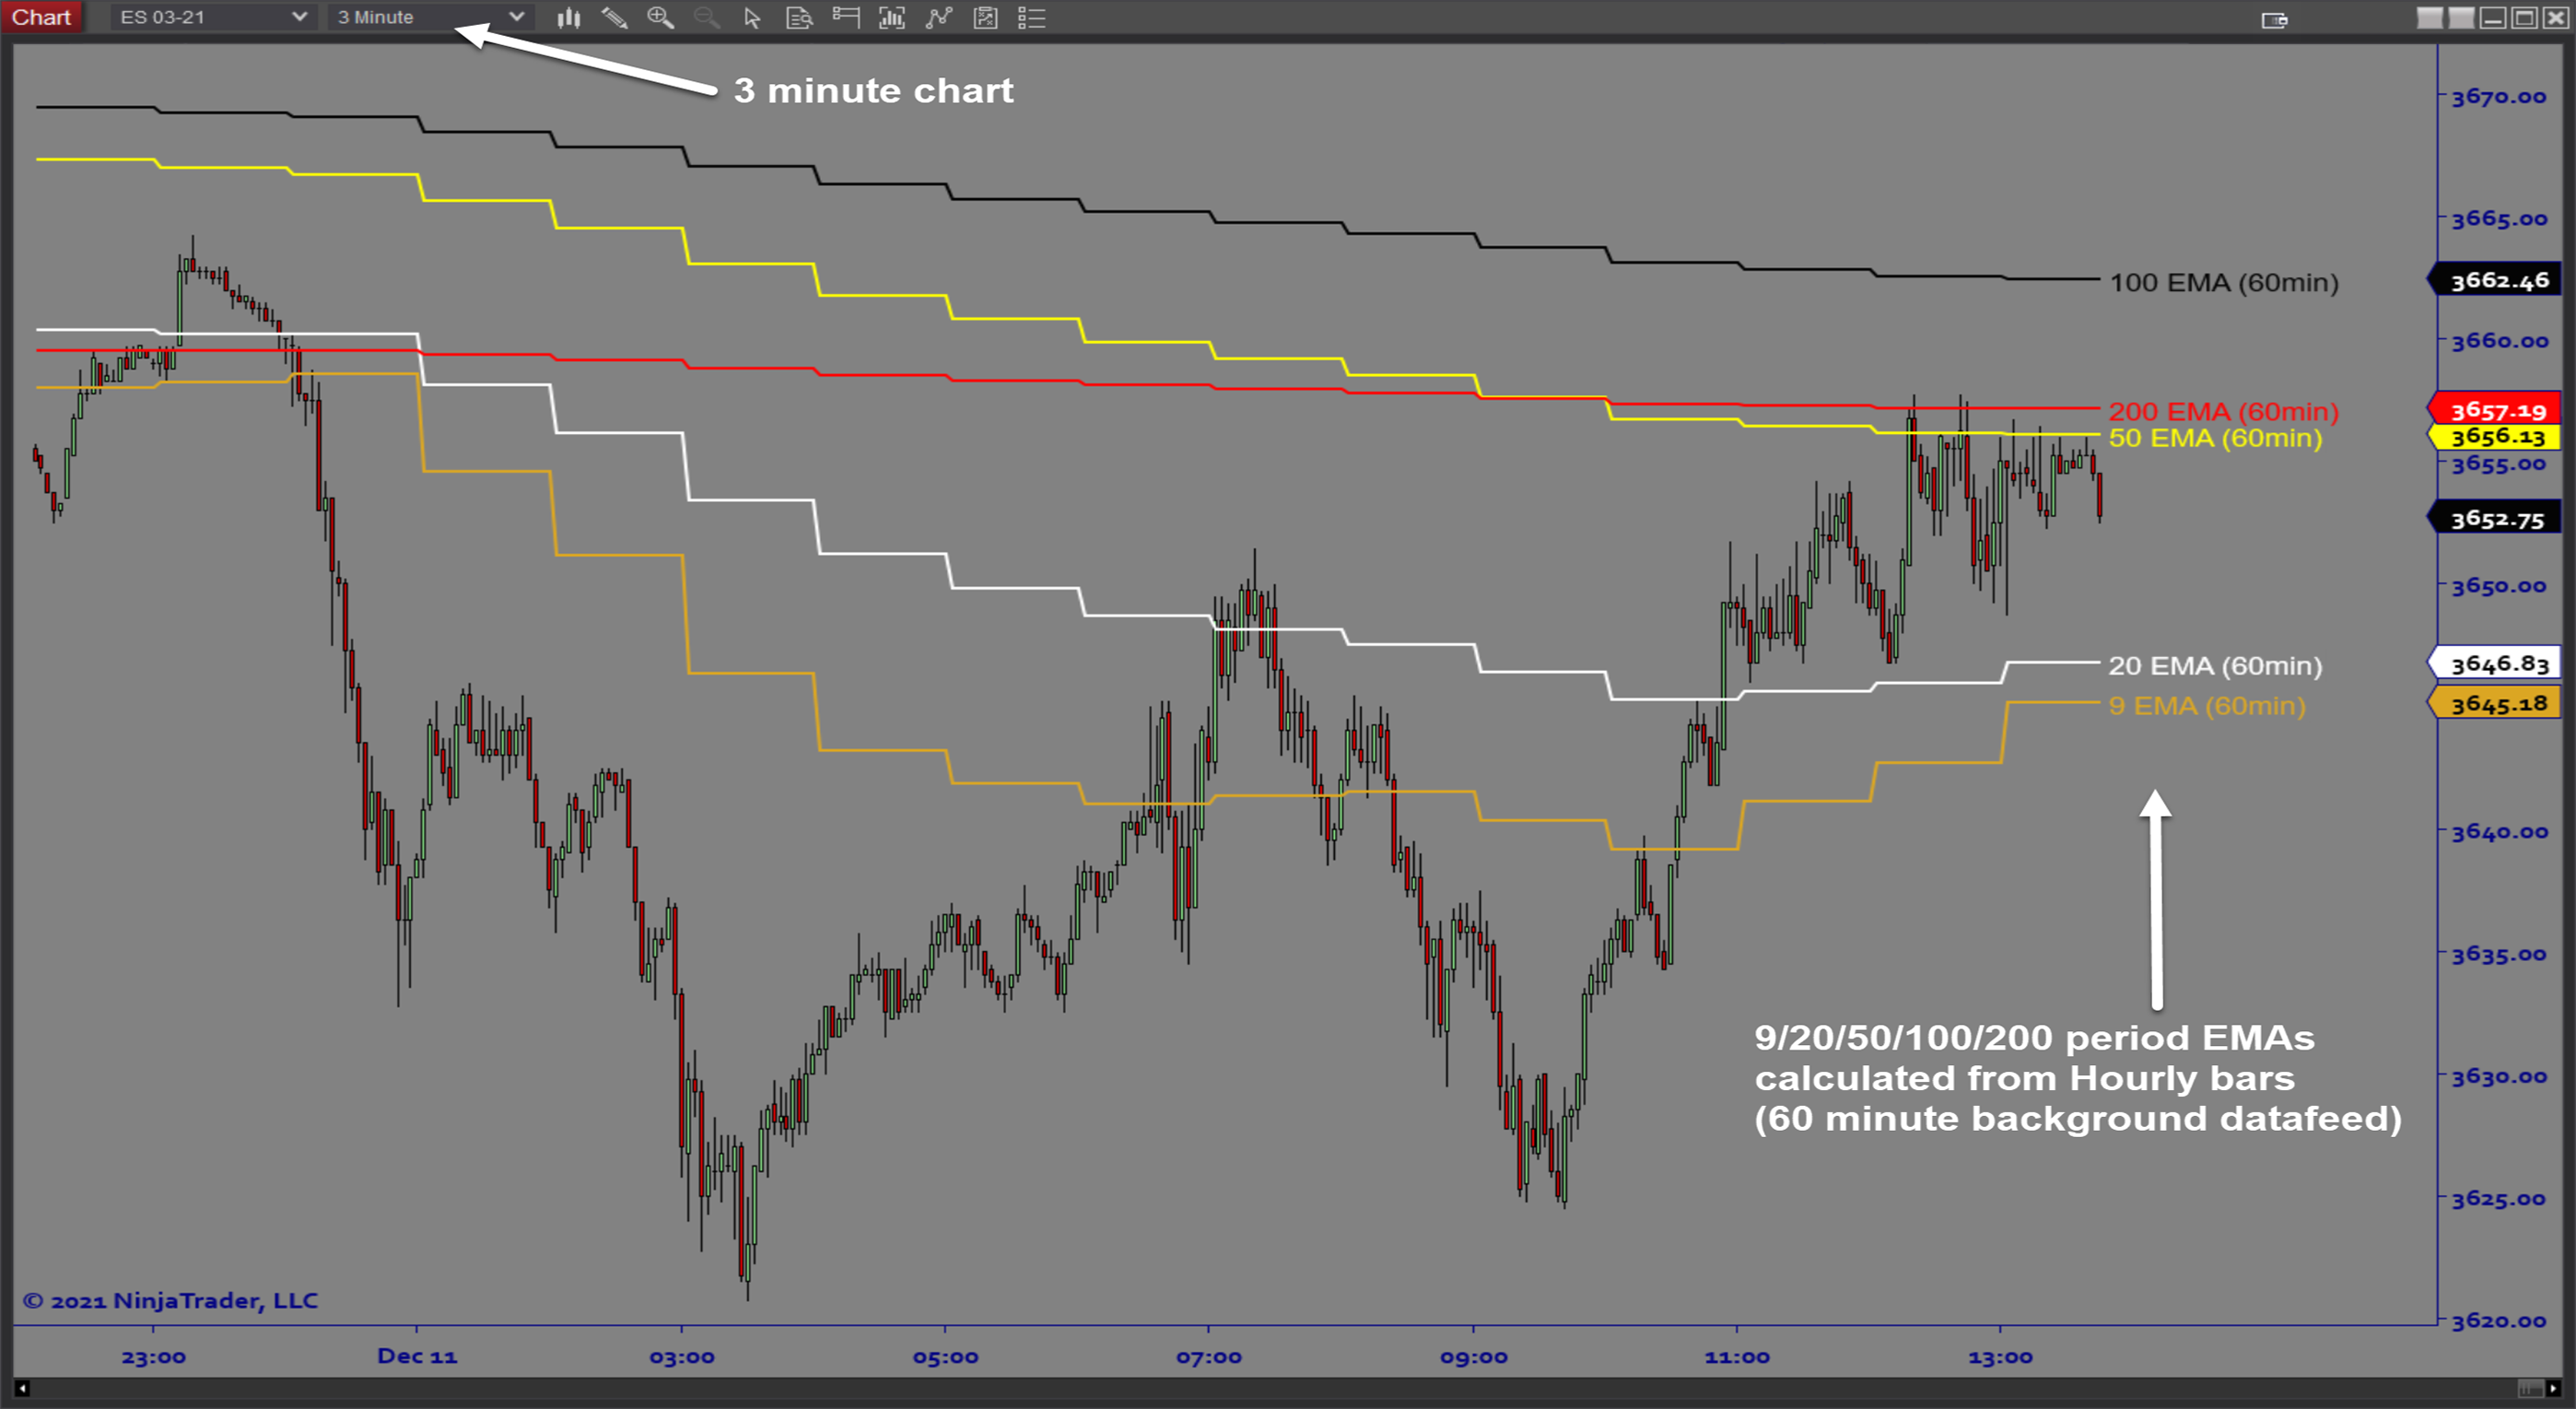
The HTF_Averages software is a multiple time frame moving average indicator. This plots moving averages from higher times and on multiple timeframes so you can use large time frames MA’s while trading smaller time frames.
Purpose:
Traders need the HTF Averages software because screen real estate is limited. Traders who use higher timeframe moving averages for directional bias no longer have to open a separate chart. This tool will place a moving average of any timeframe on your trading chart. You can now accomplish with one chart what used to require 2.
Elements:
- Display a HTF Moving Average on your primary timeframe chart
- Display up to 7 different Moving Average Lines – each a different user defined Period
- Period labels for each of the 7 MA Lines
- Select SMA or EMA for moving average calculation
- Option to display historical HTF Average levels or current day only
Functions:
The HTF Averages software is best used by determining what higher timeframe moving averages you want to keep track of to keep you on the right side of the dominant trend. Then you adjust the software settings so that it displays those levels directly on your trading chart. You can choose to either see only today’s levels or to see historical levels for better context.
Problem Solved:
- Stops traders from second guessing directional bias
- Stops traders from second guessing support and resistance
- Stops traders from trading in the wrong direction
- Stops traders from ignoring important areas of interest
- Stops traders from using too much screen real estate for market conditions rather than trading activity


